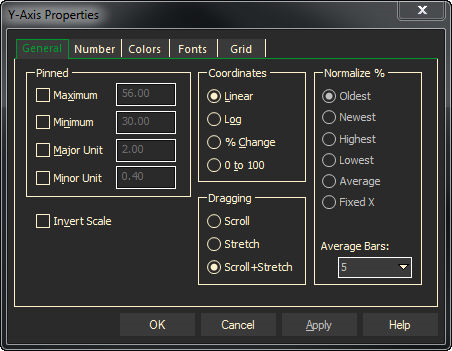
Y-Axis General Tab
To Change the Y-Scale Properties, right-click on the Y-Scale, and select Y-Scale Properties.

- Pinned: these selections allow you to manually pin and customize the Y-Scale. When each box is un-checked, the value is determined automatically.
- Maximum: set the top boundary of the Y-Scale.
- Minimum: set the lower boundary of the Y-Scale.
- Major Unit: set the major scale unit. These are the numbers that are visible on the Y-Scale.
- Minor Unit: set the minor scale unit. These are the smaller dashes on the Y-Scale.
- Invert Scale: invert (or reverse) the Y-Scale so that the Maximum price is at the bottom of the scale, and the Minimum price is at the Top.
- Coordinates:
- Linear: select for a standard linear Y-scale – the default selection
- Log: select for a logarithmic Y-scale.
- % Change: select for a % Change Y-scale. When this is selected, the different “Normalize %” options become active.
- 0 to 100: select for a 0-100 Y-scale. The highest value in the displayed chart will become 100, and the lowest will become 0.
- Dragging:
- Scroll – When in Scroll mode, dragging the scale will simply move the scale up or down, maintaining the spacing.
- Stretch – When in Stretch mode, you can drag the upper or lower part of the scale towards or away from the center, condensing or expanding it.
- Scroll + Stretch – Select to do both Scroll and Stretch
- Normalize %: these items becomes active when the “% Change” Coordinates are selected.
- Oldest: prices are normalized to 0% from the oldest price on the current chart.
- Newest: prices are normalized to 0% from the newest price on the current chart.
- Highest: prices are normalized to 0% from the highest price on the current chart.
- Lowest: prices are normalized to 0% from the lowest price on the current chart.
- Average: prices are normalized to 0% from the average price on the current chart.
- Fixed X: a “normalize” vertical line will appear on the chart. Drag to any price on the chart and the prices will be normalized to 0% at the lines current location. The width of the bar is determined by the “Average Bars” setting.
- Average Bars: allows the selected number of periods to be averaged for the Normalize % settings.
Current values for each item will be shown in the box to the right of it. For each item you checked, substitute the values you want to use.
Click OK to exit the dialog, or select other tabs to make other changes before exiting.
Your changes will affect only the chart you have customized.
Dragging the Y-Scale
- You can also drag the Y-Scale up or down to expand it or contract its range.
- Your Y-Scale has three drag modes — Scroll + Stretch, Scroll only or Stretch only.
- When it is in Scroll mode, dragging the scale will simply move the scale up or down, maintaining the spacing.
- Stretch move will stretch the bars and change the scale.
- When it is in Scroll + Stretch mode, you can drag the upper or lower part of the scale towards or away from the center, condensing or expanding it.
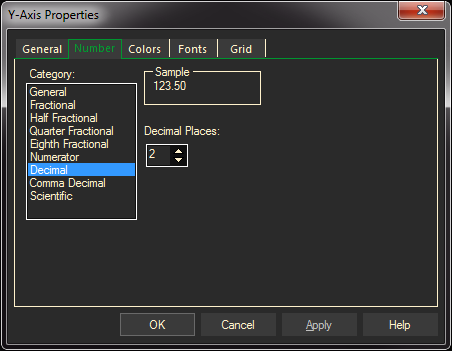
Y-Axis Number Tab
The number format properties will change the formatting for the numeric data to include, decimals, fractions, etc.
To Change Number Format:
- Right-click on the Y-Scale, and select Y-Scale Properties.
- Click the Number tab at the top of the Properties dialog.
- Under Category, select a number format.

If additional choices are offered to the right of the Category list, make selections there also. (For example, if you selected
Numerator format in step 2, a new box is displayed so you can select the type you want.) A sample of your selection will be shown at the top of the dialog.
Click OK to exit the dialog, or select other tabs to make other changes before exiting.
Your changes will affect only the chart you have customized.