A historical volatility chart displays the volatility of the market. The numbers are calculated on a percent-per-annum basis. Under Annual Days, enter the number of actual trading days in the year. There are approximately 250 actual trading days per year for an instrument traded five days a week.
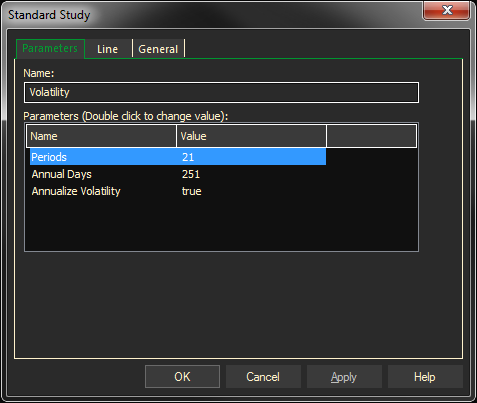
Parameters:
Symbol — data source symbol.
Period — time interval for each value calculation.
Annual Days — trading days per year.
Type — Yes or No to calculate annualized volatility
How ProphetX interprets volatility
- Annualize = yes, implies multiplying the volatility calculation by the sq root of the Annual Days setting.
Volatility of Return:
- Calculate (closing price – yesterdays closing price) / yesterdays closing price0 for every datum in the series.
- Smooth the function created in step 1, by taking the Standard deviation of the data over the period parameter entered by the user (21 is the default). Without this step the function created by step 1 would look very choppy.
- Multiply the resultant function of step 2 by an amplification factor equal to the square root of the number of annual trading days (250 working days per year is the default). This is nothing more than an arbitrary weight being applied to every single data point. It does nothing else to clarify the data or make it smoother. It just multiplies every datum calculated in step 2 by the same amplification factor. Entering a value of 1 for the annual days will result in the multiplying of every data point from step 2 by the square root of 1 or 1.
To summarize in equation form:
Volatility of Return:
- Curve #1 (closing price – yesterdays closing price) / yesterdays closing price
- Curve #2 Standard Deviation (Curve #1, periods)
- Result Square Root(Annual Days) * Curve #2
Or
- Just multiply the standard deviation by the square root of 251 (# of working days in the year) to arrive at the annualized volatility.
Adding the Volatility Study to a Chart
- Click on the f(x) Studies docked pane window.
- Click on the plus sign to expand the fx Standard.
- Find the Volatility study, drag and drop it on the chart
Or
- Right-Click on a blank part of the chart and select ADD STUDY.
- The Add Study dialog box will open.
- Under Data Source, you will find a list of charts and studies in the window. Select the one on which you want the new study to be based.
- Under Studies, select the study you want to add to the window. The library of studies will include standard ProphetX studies plus those that you have created. The Most Recent will include studies that you have previously used.
- Under Add To, select the stack you want to add the study to, or select <New Stack> to create a new stack for the study.
- Click OK to exit.
Changing Parameters
Do either of the following to change the parameters:
- For an existing study on a chart, right-click on the study and select PROPERTIES on the pop-up menu, and modify as necessary.
- Right-click on the study name listed in the f(x) docked pane and make the changes in the displayed dialog. Update will save the parameters permanently.