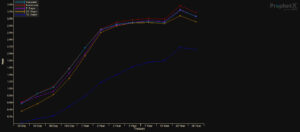
- Displays current and historical US Treasury Yield data
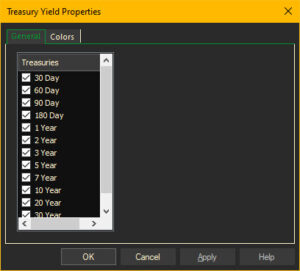
- Treasuries are select-able in Settings and in Properties
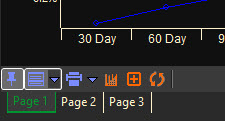
- Add Date button allows adding additional lines
- Lines can be deleted individually
- Grid toggle button toggles between Graph and Grid views
- The refresh button can be used to update the display, for example, if ProphetX was running overnight
- Settings for Show vertical and horizontal grid lines apply to Grid view
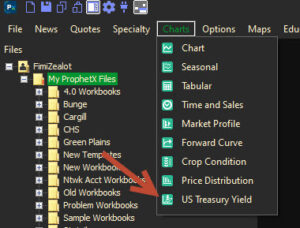
To View the US Treasury Yield
- From the top menu, select Charts
- Under drop down menu, select US Treasury Yield

Example of the US Treasury Yield Display

- Right mouse click on the display to change the Treasuries used in the display
- Click on OK

- At the bottom of the display, you can use the icons to change your display settings
- Toggle between a chart and tabular display
- Add Date to select a line based on the number of trading days back or starting date
- Refresh will update the chart
