The TTM Squeeze indicator measures the relationship between two studies: Bollinger Bands and Keltner’s Channels. When the volatility increases, so does the distance between the bands.
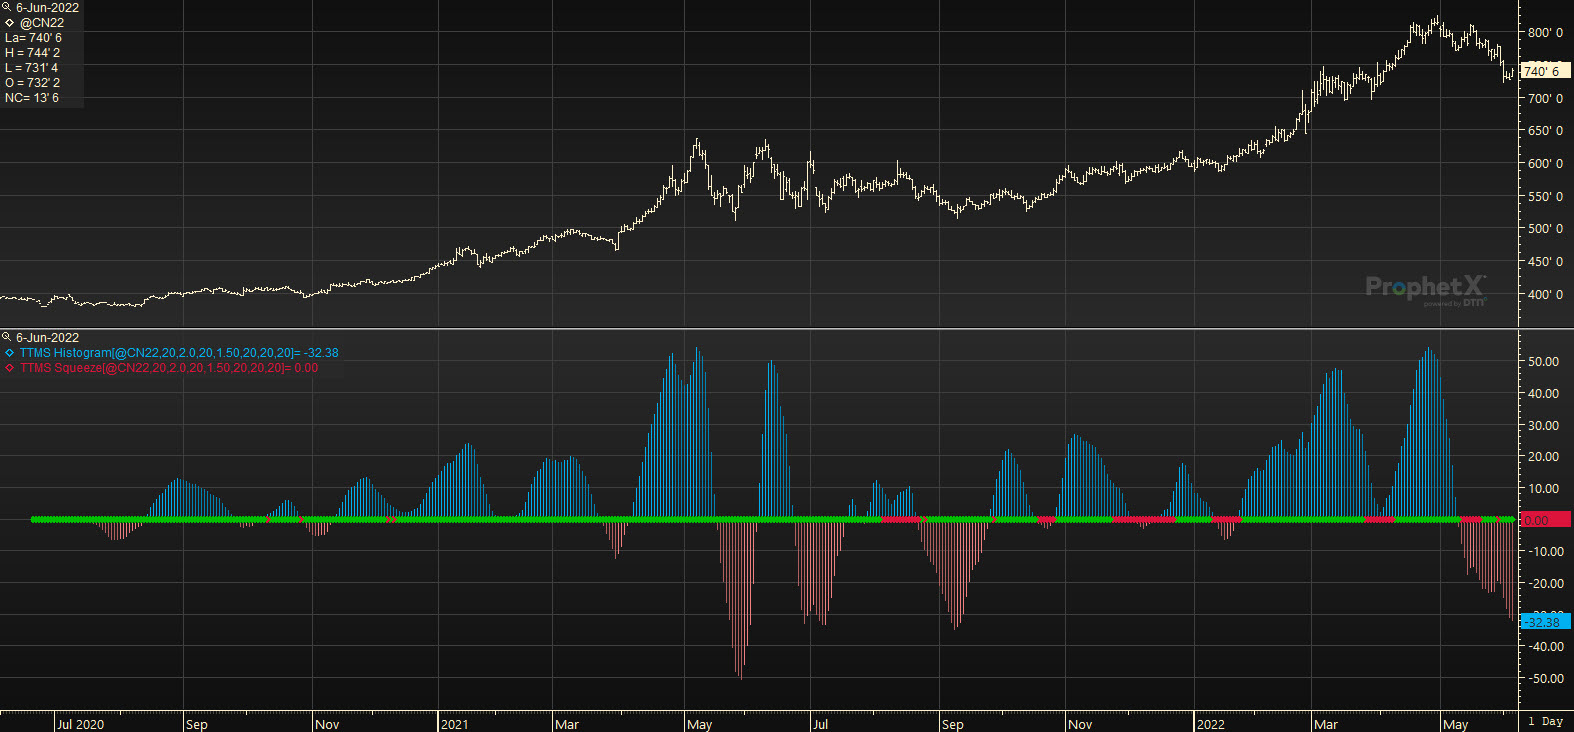
There are two components of the TTM Squeeze indicator: the squeeze on/off dots and the momentum histogram.
The squeeze dots signal when volatility conditions are right to buy. While volatility levels are low, the dots will be red. When volatility increases, the squeeze has “fired” and the dots will be green.
The momentum histogram helps to determine the direction in which to trade. Momentum above the zero line will be blue, below will be red.