Trix uses a one-day momentum of a triple exponential smoothed price series to produce an indicator which is cycle dependent. Changes in the Trix direction are less prone to whipsaws than standard cycle-momentum indicators. The period is chosen to filter out any insignificant cycles shorter than the period. Raising the number of days will remove more small cycles and smooth out the oscillator, but at the loss of sensitivity. The more smoothing that is applied to the data, the more of a lag in the oscillator, but not nearly the lag of a normal moving average.
Parameters:
Symbol — data source symbol.
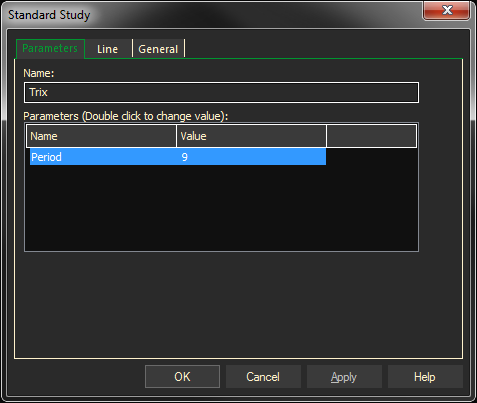
Period — time interval to examine for each value.
Example with Defaults: TRIX (SP@1, 9)
Adding the Trix Study to a Chart
- Click on the f(x) Studies docked pane window.
- Click on the plus sign to expand the fx Standard.
- Find the Trix study, drag and drop it on the chart
Or
- Right-Click on a blank part of the chart and select ADD STUDY.
- Under Data Source, you will find a list of charts and studies in the window. Select the one on which you want the new study to be based.
- Under Studies, select the study you want to add to the window. The library of studies will include standard ProphetX studies plus those that you have created. The Most Recent will include studies that you have previously used.
- Under Add To, select the stack you want to add the study to, or select <New Stack> to create a new stack for the study.
- Click OK to exit.
Changing Parameters
Do either of the following to change the parameters:
- For an existing study on a chart, right-click on the study and select PROPERTIES on the pop-up menu, and modify as necessary.
- Right-click on the study name listed in the f(x) docked pane and make the changes in the displayed dialog. Update will save the parameters permanently.