A Time and Sales display shows all transactions that have occurred on an individual instrument during the trading day.
Opening a Time & Sales Window
- Select Charts/Time and Sales from the Maim Menu Bar
- Type the symbol for the instrument to be displayed and press Enter.
Example of Times and Sales in the Across Columns selection
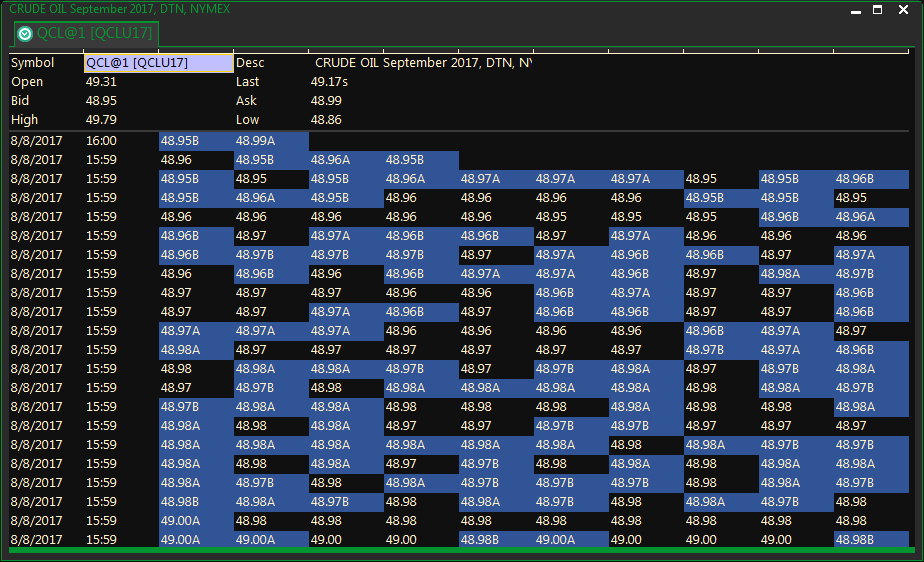
Example of Times and Sales in the Down Rows selection
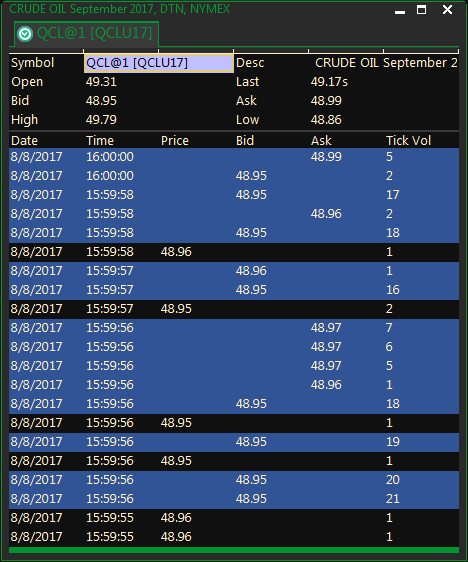
Right-click in the Time and Sales display to change the view for that display only or using the context toolbar buttons as shown below.
The default display for every Time and Sales display you open is selected in the File -> Settings, Under Time and Sales

The Context Tool Bar
The Context Tool Bar is located at the bottom of the window frame. The F2 key toggles the toolbar off or on. Use these buttons to make changes to the contents of the display.

The actions assigned to the icons are, from left to right:
- Pin/Unpin ContextBar (F2) – View or hide the Context Bar by pressing the Pin/Unpin icon. Use the F2 key to toggle the toolbar off or on.
- Link views in split pane defines where to place the linked view, either at the bottom of the current display, or in a separate window itself. (Indented is the default for opening the window in the same frame)
- Toggle Vertical/horizontal Split Pane – View the Split Pane window vertically or horizontally.
- Print View(s)/Tabs – Print the current tab or all tabs.
- Change the view to Scroll Down or Scroll Across
- Toggle Gridlines on or off
Correction Codes and Fields
The prices may include any of the following codes:
| F | Fast Market |
| N | Insert |
| C | Change |
| D | Delete |
| ? | Questionable Price |
- Right-click on the Time & Sales Window and select Properties from the pop-up menu.
- In the Properties dialog, select the Columns Tab
- In the Field section, click to check the Fields you would like to display.
- Highlight a Field name and press the Up or Down button to change the order of the Field Display.
- To display all fields press the Select All button.
- To remove all field selections press the Clear All button.
- Press the Reset button to return the settings to the default.
In the Records section, click to check the corrections you would like to display.
- To display all Records press the Select All button.
- To remove all selected Records press the Clear All button.
- Press the Reset button to return the settings to the default.
To exit, do either of the following.
- Select OK to apply changes and exit.
- If you select Cancel, only changes made before clicking the Apply button will remain.
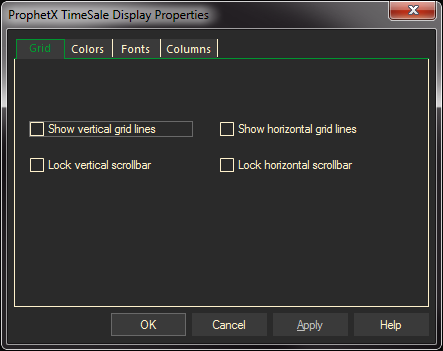
Time and Sales Properties
Right-click on the Time & Sales Window and select Properties from the pop-up menu.
Grid
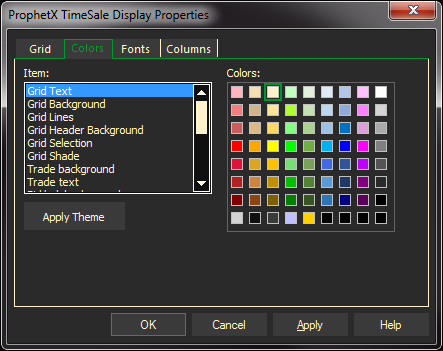
Colors
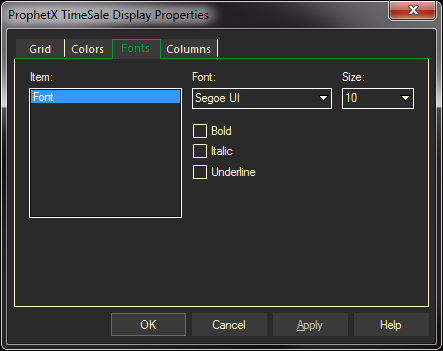
The Colors and Fonts tab follow the same format for most properties dialogs. Colors will allow you to change the colors and fonts to your individual preferences.
Fonts
Columns
In the Properties dialog, select the Columns Tab
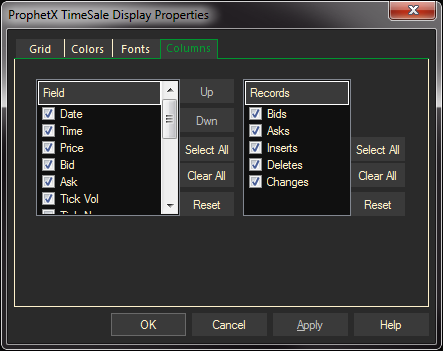
In the Field section, click to check the Fields you would like to display.
- Highlight a Field name and press the Up or Down button to change the order of the Field Display.
- To display all fields press the Select All button.
- To remove all field selections press the Clear All button.
- Press the Reset button to return the settings to the default.
In the Records section, click to check the corrections you would like to display.
- To display all Records press the Select All button.
- To remove all selected Records press the Clear All button.
- Press the Reset button to return the settings to the default.
To exit, do either of the following.
- Select OK to apply changes and exit.
- If you select Cancel, only changes made before clicking the Apply button will remain.