A tabular display provides chart data in table format. ProphetX’s tabular displays also allow you to dynamically link historical data to a spreadsheet application.
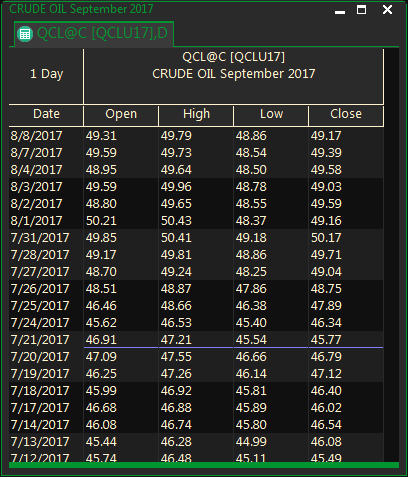
To Open a Tabular Display
- Select Charts/Tabular from the Main Menu Bar
- In the Symbol or Expression box, type an instrument or symbol.
Tip: You can also use the same alternate symbols available for charts, such as free-form functions, (ex: QNG@1-QNG@2) and alias symbols. (ex: QCL@1)
- Press the Enter Key on the keyboard
Adding Additional Symbols
- While the original tabular display is open, start typing a new symbol.
- Hold down the Ctrl key and then press enter.
This will add the new data set to the one that is currently there.
Tip: If you don’t hold down the Ctrl key the current instrument will be replaced with the new one.
Freezing and Unfreezing Columns
When several instruments are displayed in 1 window, they all have the same date column and it’s sometimes hard to remember which day you’re looking at. Therefore, you can freeze the date column so the display will scroll to the right while always showing the date in first column.
- Highlight the column you want to freeze
- Right click and select Freeze Columns
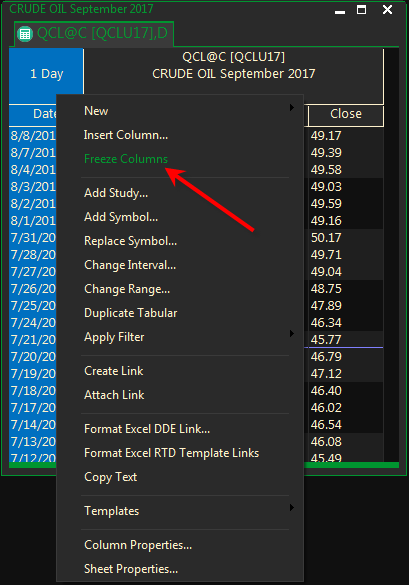
To unfreeze the column, right click on the column next to it and select Unfreeze Column.
The Date and Time columns are automatically frozen in place while horizontally scrolling the display. There is no Unfreeze option for Time and Date. If you do not want to display the date and time, just size the column to “hide” it.
You can still user the freeze functionality for columns other than time and date just like you did in previous versions.
Tabular Displays Showing Only Expiration Prices
You can display a single line to show the high, low, open and close for the entire contract at expiration by typing ,E after the root when creating or changing a continuous display. Ex: QCL@C,E
Tabular Sheet Properties
To Customize Colors, Font, and Number Formats
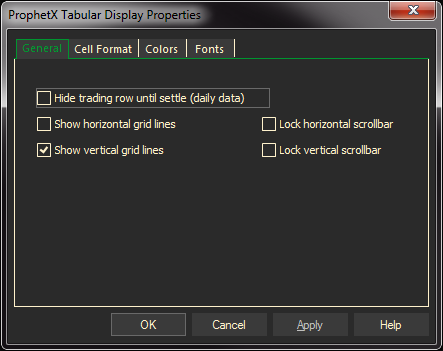
- Right-click on any column heading of the tabular window and select Column Properties
The General Tab determines who the most current trade will display – immediately or after the settle on daily data.
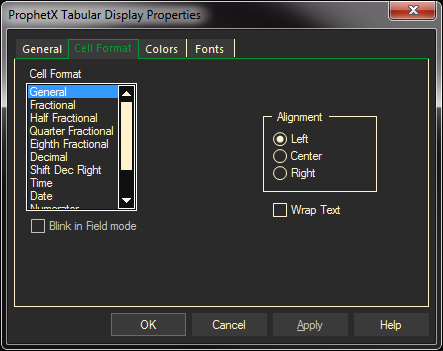
Cells, Colors, and Fonts
- To change cell formats select the new format and type. Column alignment defaults to left-aligned. Change alignment on the cell format tab as well.
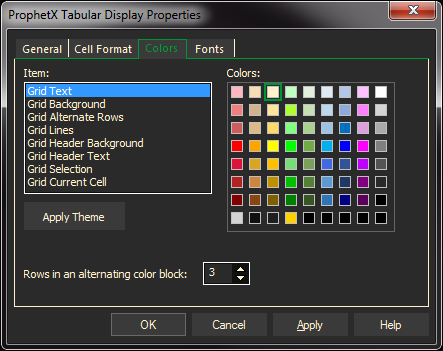
- Under the Colors tab, select the item to be changed and then the new color.
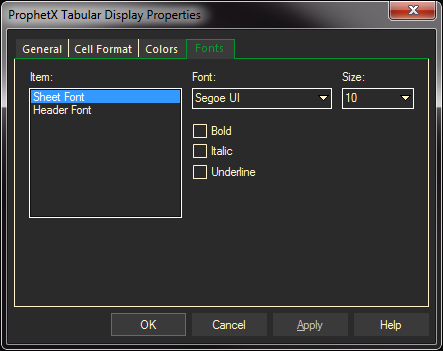
- Under the Fonts tab, select a font, style, size, and special effects. As you make selections, the text under Sample will change to show them. If your system does not support selections made in the font dialog, defaults will be used.
- At any time, you can click Apply to view your changes while the dialog remains open. After making your changes to the selected area, do either of the following:
- Select OK to apply changes and exit.
- Select Cancel. Only changes made before clicking Apply will remain.