The Strategy View allows you to create and view various options strategies – either standard industry strategy spreads or your own free-form strategies.
To Open a Strategy View Window
- Select Strategy View from the OPTIONS menu on the Main Menu Bar
- Under Root Symbol, enter the Root Symbol you want to analyze
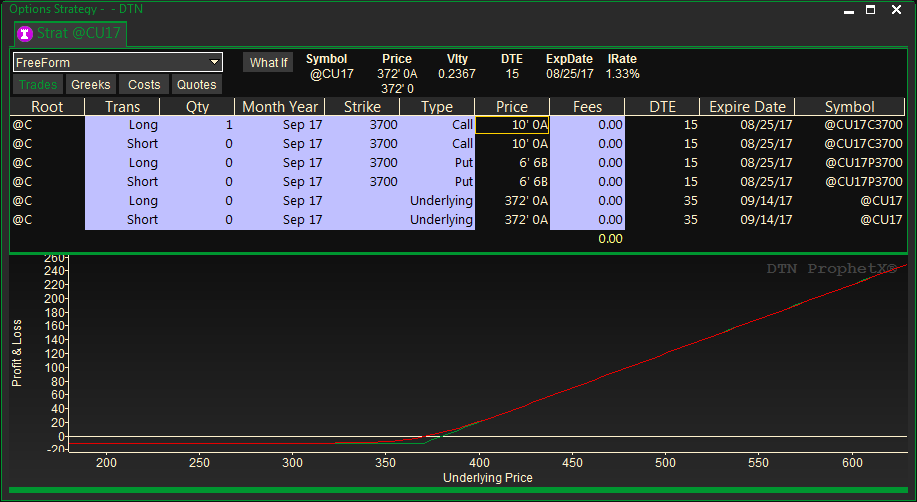
Overview of colors:
The fields in white can be customized. These fields will vary by spread.
Changing Spreads
To change the Spread, click on the drop-down arrow and select a spread.

Trades
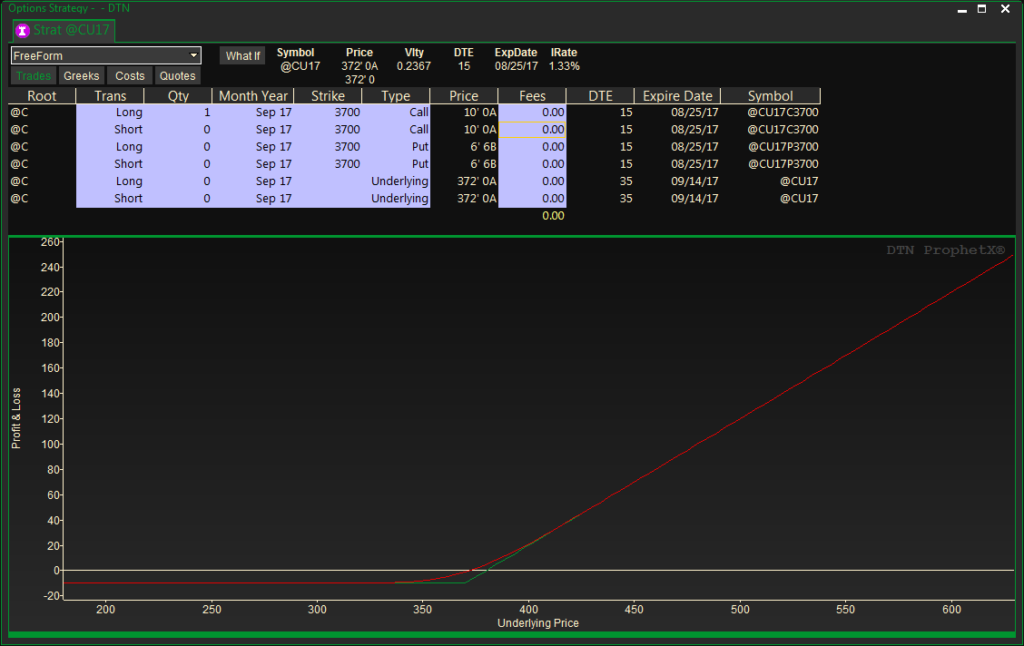
The Trades section at the top of the window contains the underlying instrument as well as other properties that apply to the individual strikes.
Customizing the Trades Section
The fields in white can be customized. To change the value, double-click the entry, click on the drop-down arrow and select a field from the list displayed, then press the ENTER key. If no drop-down arrow is available type the value and then press the ENTER key.
- Root – Double-click on the Root Symbol and enter the new root symbol, then press the ENTER key.
- Trans – Double-click on the Long/Short position and select Long or Short from the list displayed, then press the ENTER key.
- Qty – Double-click on the Quantity and enter a new value, then press the ENTER key.
- Month Year – Double-click on the Mon Yr (Ex: Jul’14) and select Month and Year from the list displayed, then press the ENTER key.
- Strike – Double-click on the Strike Price and select a Strike Price from the list displayed and press the ENTER key.
- Type – Double-click on the Type and select Underlying, Call or Put from the list displayed and press the ENTER key.
- Fees – Double-click on the Commission and enter a value and press the ENTER key.
As you are making changes the chart in the lower portion of the screen will change as well.

For FreeForm strategies you can add addition lines if necessary – right click anywhere in the strategy entry area and select Add Leg
You can also delete legs your currently have, as well as move the various entries up or down to make the strategy more relevant.

Example:
Greeks
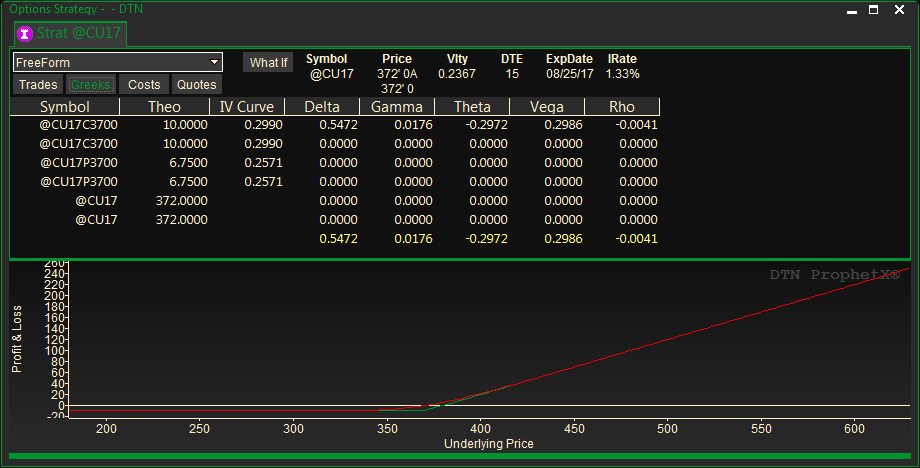
The Greeks Section will display the Symbol, TheoVal, IV Curve, Delta, Gamma, Theta, Vega and Rho values.
Costs
The Costs section at the top of the window shows the Trade Prices.
Customizing the Costs Section
The fields in white can be customized. To change the value, double-click the Field category, click on the drop-down arrow and select a field from the list displayed, then press the ENTER key. If no drop-down arrow is available type the value and then press the ENTER key.
- Trans – Double-click on the Long/Short position and select a field from the list displayed, then press the ENTER key
- Qty – Double-click on the Quantity and enter a new value, then press the ENTER key
- Fees – Double-click on the Commission and enter a new value, then press the ENTER key
- Trade Price – Double-click on the Trade Price and enter a new value, then press the ENTER key

Quotes
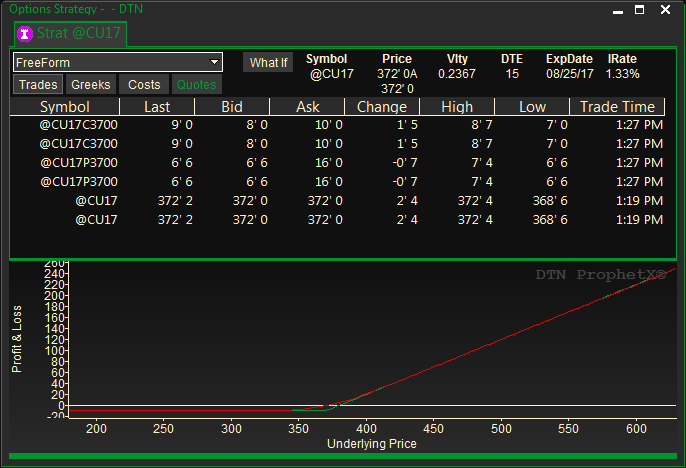
The Quotes section at the top of the window displays the actual prices that apply to the individual strikes.
Changing the Underlying Values
You may change many of the values and parameters used in options pricing as part of your assumptions and the what-if analysis that you do. To change values that affect the whole window, click on the What If button or right-click on the underlying section (bar at the top of the window) and select Properties or the What If command from the pop-up menu shown below.
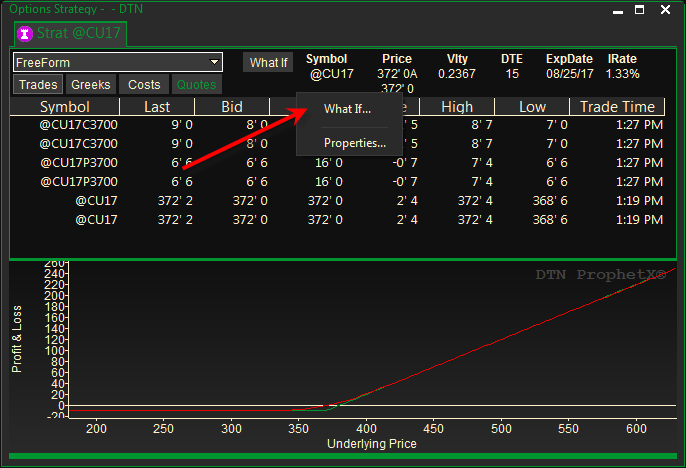
The ProphetX Options Properties displays a dialog in which you can change Vlty, Vlty Shift, DTE and IRate.

Graph
When selecting spreads and customizing underlying properties the linked graph will change accordingly.
Changing Graph Colors
- Right-click on the Graph
- Select GRAPH PROPERTIES
- Select the Item and then a color.
Tip: Changing the properties on individual pages will over-ride selections in the ProphetX General Preferences for Options.