The Stochastic Oscillator is based on the expectation that closing prices tend to occur toward the upper end of the price range while prices are increasing and toward the lower end of the price range while prices are decreasing.
There are two lines used with the stochastic study. The %K line represents where the closing price is in relation to the total price range, displaying the information as a percentage. A high %K value (above 70) indicates that the closing price is near the top of the total price range and a low %K value (below 30) indicates that the closing price is near the bottom of the total price range. The %D line is a smoothed version, or moving average, of the %K line. The standard fast study is the most highly reactive. The slow study slows down the reactions somewhat, eliminating some spurious movements.
Parameters for this study include, %K Period (enter the number of periods over which the %K line is to be calculated), and % D Period (enter the number of periods over which the %D line (the moving average of %K) is to be calculated). When a slow study is selected, enter the number of periods used in the smoothing of the %K line under %K Slowing. A value of 1 (no slowing) is considered a fast stochastic. A value greater than 1 is considered a slow stochastic.
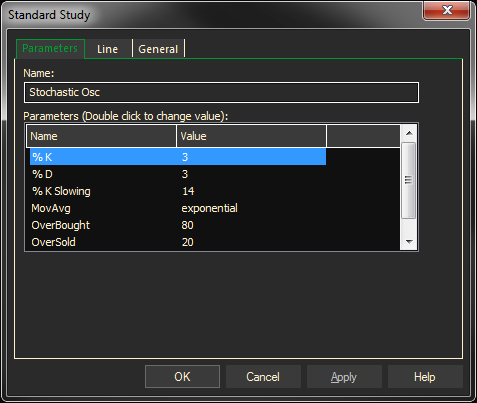
Parameters:
Symbol – Data Source Symbol
%K – number of periods to use
%D – moving average of %K
%K Slowing – apply moving average to %K. Fast is considered with no MA (value of 1), Slow is considered a Moving Average with a value greater than 1.
MovAvg Type – 0,1,2,3 (Standard, Exponential, Weighted, Smoothed)
NOTE: When this Function is used in a User Custom Study, the %D line will not be plotted. To emulate a %D line, add a Moving Average using the %K line as the Source.
Example – STOCH(Symbol,%K,%D,%K slow,Moving Average Type)
Tip: this example contains the system default parameters. You, as a trader need to determine the values for these parameters.
Adding the Stochastic Study to a Chart
- Click on the f(x) Studies docked pane window.
- Click on the plus sign to expand the fx Standard.
- Find the Stochastic study, drag and drop it on the chart
Or
- Right-Click on a blank part of the chart and select ADD STUDY.
- Under Data Source, you will find a list of charts and studies in the window. Select the one on which you want the new study to be based.
- Under Studies, select the study you want to add to the window. The library of studies will include standard ProphetX studies plus those that you have created. The Most Recent will include studies that you have previously used.
- Under Add To, select the stack you want to add the study to, or select <New Stack> to create a new stack for the study.
- Click OK to exit.
Changing Parameters
Do either of the following to change the parameters:
- For an existing study on a chart, right-click on the study and select PROPERTIES on the pop-up menu, and modify as necessary.
- Right-click on the study name listed in the f(x) docked pane and make the changes in the displayed dialog. Update will save the parameters permanently.