This study displays the high and low range between the years requested in a single instrument seasonal chart.
- Create a seasonal chart. using any symbol that does not expire, such as a stock symbol.
- Right click and select Add Study.
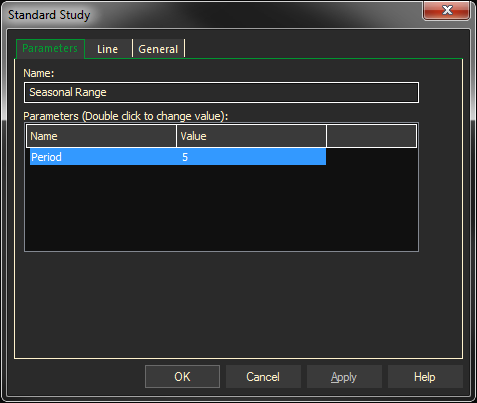
- Select Seasonal Range
- Click on Add to Stack 1
- Click OK