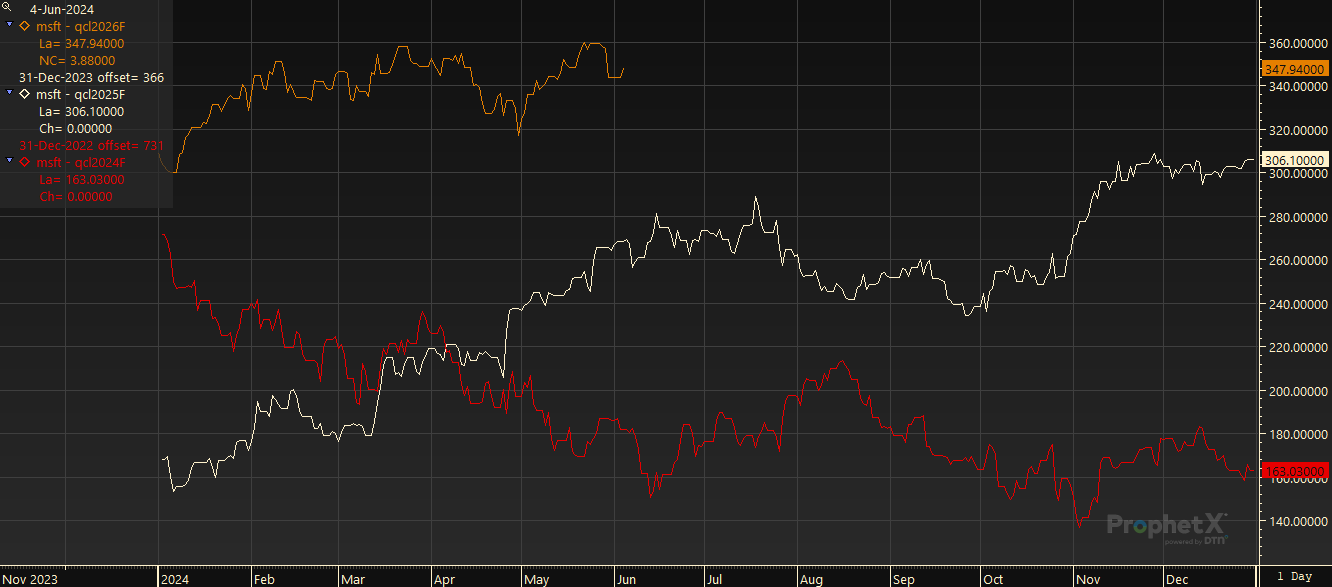
A seasonal chart shows a year over year view of an instrument and compares day by day throughout the season. In addition, you can add a seasonal average using the Multi-year average for futures or Seasonal Average for cash priced instruments, as well as a Multi-year range or Season Range for futures and cash instruments.
Opening a Seasonal Chart From the Main Menu Bar
- Select Charts/Seasonal from the Main Menu Bar
- If the symbol/expression area has information in it, click on the Clear All Button
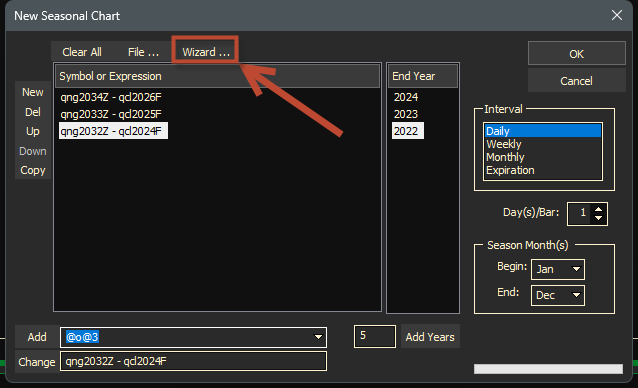
You can create a Seasonal Chart either manually or with the Wizard.
Using the Wizard
To use the Wizard, click the Wizard button. The Seasonal Chart Wizard dialog opens
Season
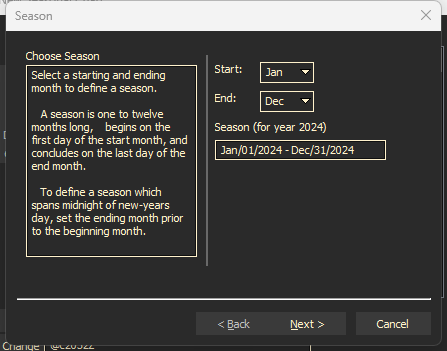
- Choose the Season you want
- Select a starting and ending month to define the season
- In the Start entry, select the month that the contract is to start.
- In the End entry, select the month that the contract ends.
- Select Next
Years
- Chose the Years you want to Chart
- ProphetX will create one chart line per selected year
- To make changes, select Charts/Seasonal from the Main Menu Bar. The most recent seasonal charting parameters are listed. You can manually change entries, or go to the Wizard and make changes there.
- Select Next

Contract Form
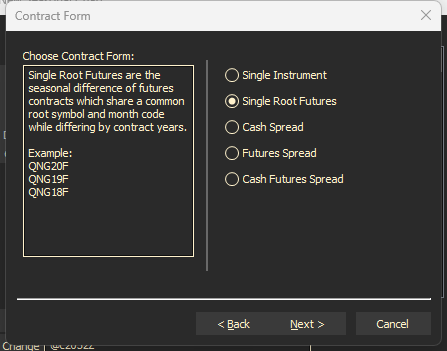
Select the type of instrument you want to chart.
- Single instrument – Comprise one historic set of data split among different years
- Single Root Futures – Are the seasonal difference of future contracts which share a common root symbol and month code while differing by contract years
- Cash Spread – Split the seasonal difference between two non-futures contracts over different years
- Futures Spread – Are the seasonal difference between two groups of futures contracts where those contracts are adjusted for different contract years.
- Cash Futures Spread – Are the seasonal difference between a single non-futures contract and a group of futures contracts where those contracts are adjusted for different contract years.
Select Next
Symbol
- The information requested on this screen will differ depending on the type of Contract Form you selected in the previous screen.
- In this example, we are using a Single Root Future
- Here you need to select the Future Root, the month the contract terminates in and the years you want to chart.
- Select Finish

New Seasonal Chart Screen
- You will be taken back to the New Seasonal Chart Screen.
- This screen could have been setup manually also, without the Wizard. Changes can be made, if needed to any of the data.
- Click OK

Your seasonal chart will display.

To make changes, Select Char/Seasonal from the Main Menu Bar. The most recent seasonal charting parameters are listed. You can manually change entries or go to the Wizard and make changes there.
Seasonal Chart Range
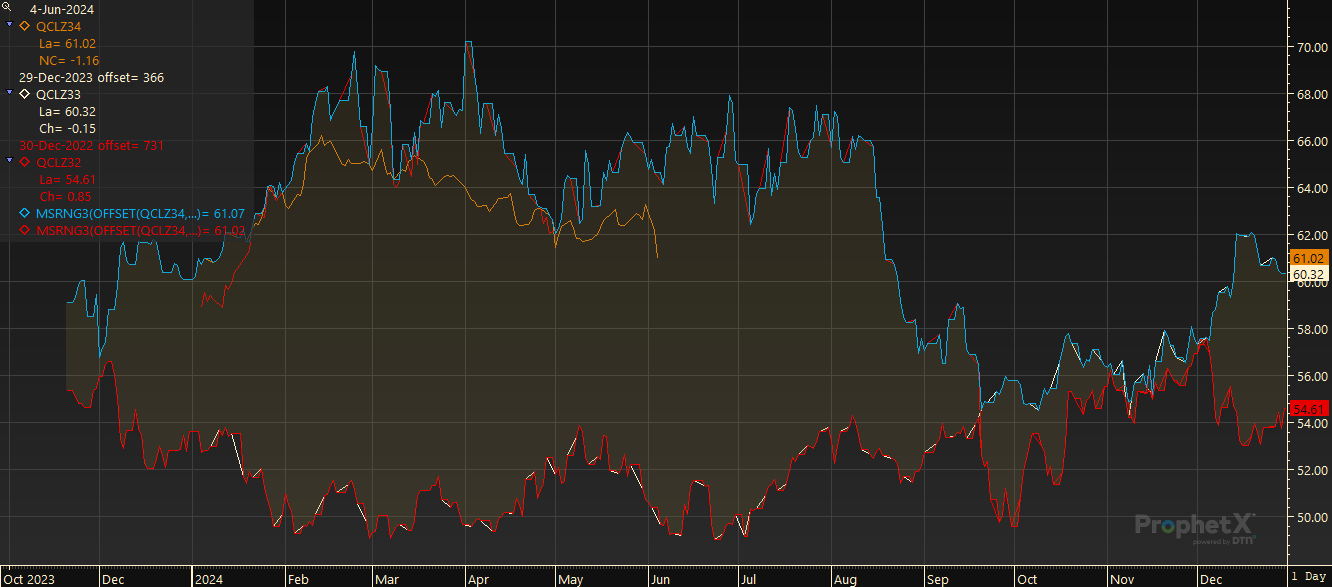
The MultiSource Range study displays the range between the highs and lows for each day.
- Find the MultiSource Range in the Standard Studies list Under Studies and Functions.
- Drag and drop it on the chart to shade it between the lines.
Example of Chart with MultiSource Range
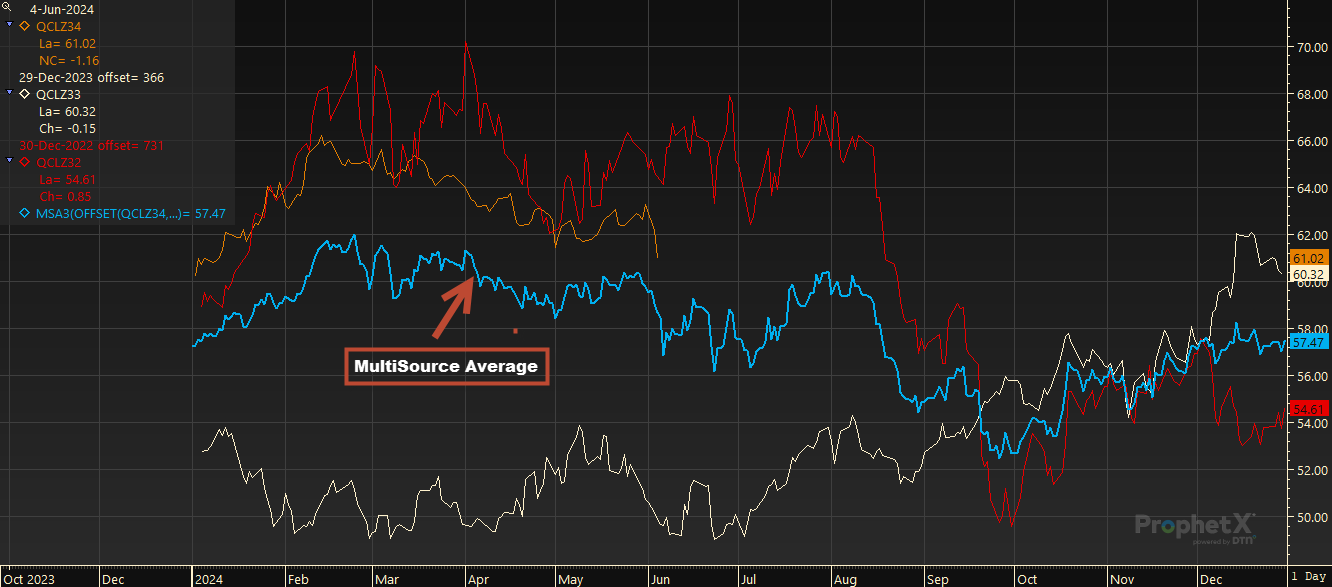
Seasonal MultiSource Average
This selection must be used when doing seasonal charts with futures contracts.
- Find the MultiSource Average in the Standard Studies list Under Studies and Functions.
- Drag and drop it on the chart.
Tip: If you’re working with cash instruments, you would use the Seasonal Avg and Seasonal Range studies.
Seasonal Charting Examples
- Example of a Corn futures seasonal chart for the June contracts that expire in June:
- The chart will display from May of last year through June of this year when the contract expires. Previous years line up on their expiration dates.

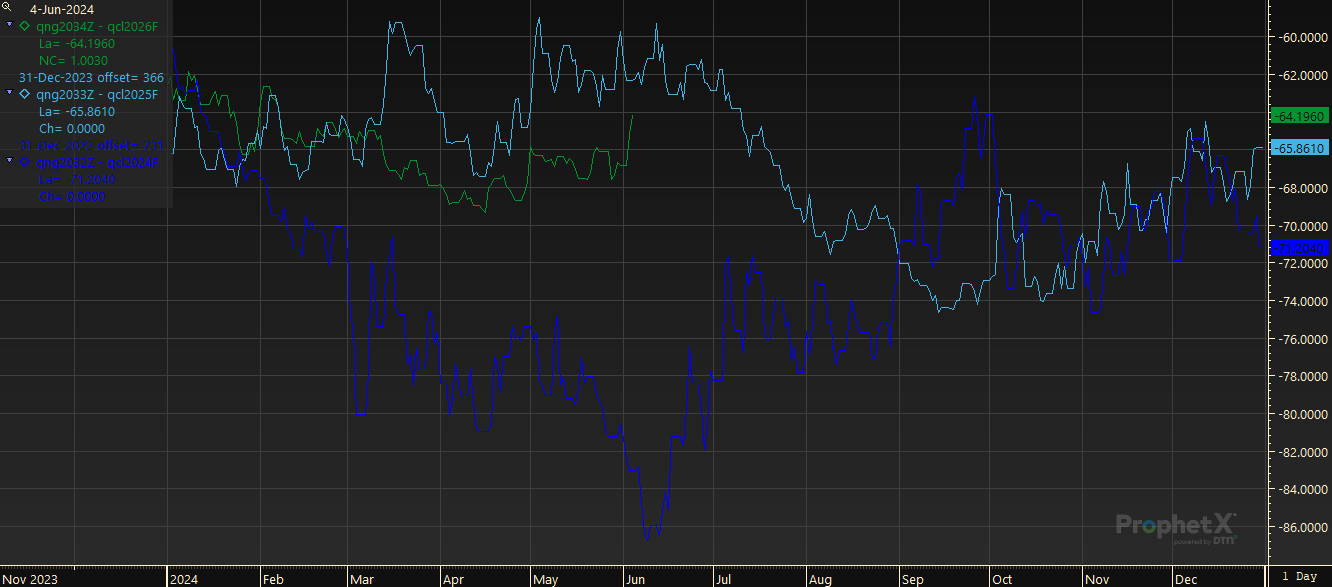
Example of a Seasonal Futures Spread chart:
- In this chart we’re subtracting a 2024 Jan Crude Oil contract from a 2034 Dec Natural Gas contract so you need to watch the contract dates carefully. When doing seasonal spreads, you will always use the oldest contract to determine the seasonal beginning and ending.
- The season will always correspond with the contract that will expire first.
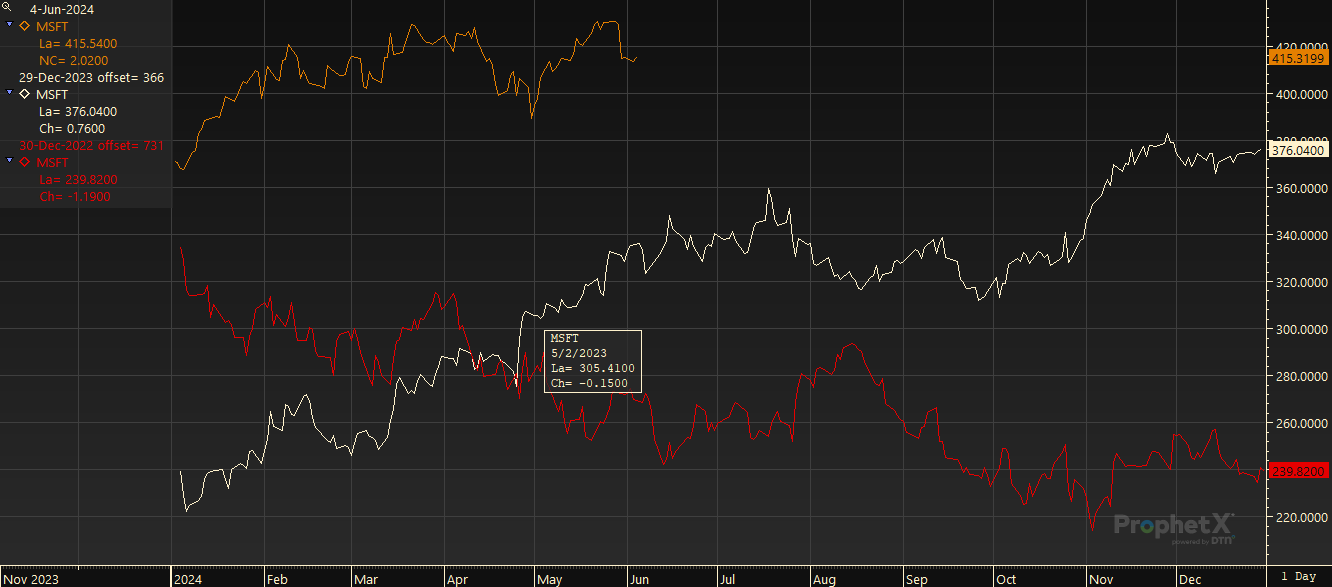
Example of Single Instrument Chart
- A Single Instrument season chart uses any instrument that doesn’t have expiration, such as stock symbols, cash prices, etc.
- For single instrument seasonal charts, the season will typically be Jan Dec and you are separating the history of the instrument to overlay it year over year.
Example of Cash Spread Chart
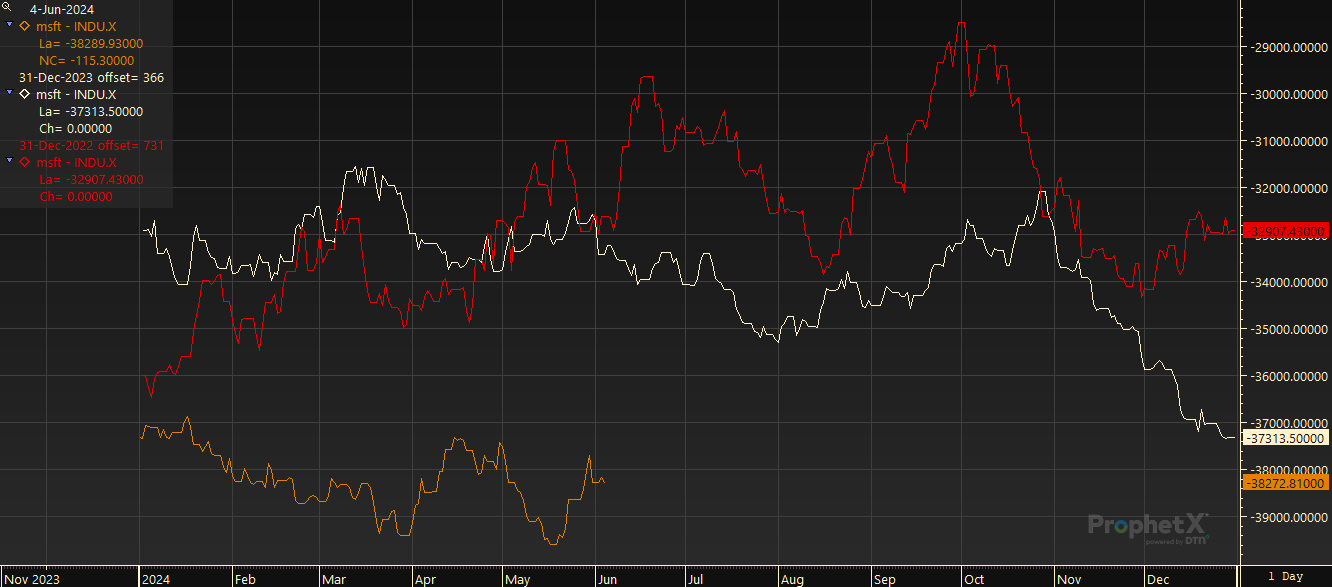
- Cash Spreads work like single instrument seasonal charts in that they separate the years and overlay each year from Jan Dec, but they display the spread between 2 instruments that do not have expiration.
- This example does a seasonal on a spread between the Microsoft and the Dow Jones 30 Industrials
Example of a Cash Futures Spread Chart
- Cash to Futures seasonal charts display the spread between a cash commodity and a futures commodity.
- In this example, we are using Microsoft and Crude Oil
