The relative strength index (RSI) is a measure of the velocity of directional price movement. It uses averages of Up closes and Down closes over a given period to calculate an index or how much strength is left in a trend. The RSI is plotted on a scale of 0 to 100, with values above 70 indicating that the market is overbought and with values under 30 indicating that the market is oversold. Enter a value under Smoothing to create a moving average of the RSI.
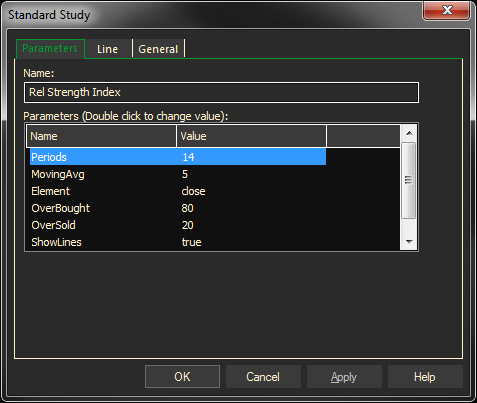
Parameters:
Symbol — data source symbol.
Period — time interval to examine for each value.
Smoothing Period — moving average period for smoothing line.
Element — price field to use for calculation (Close, High, Low, Open)
Adding the Relative Strength Index Study to a Chart
- Click on the f(x) Studies docked pane window.
- Click on the plus sign to expand the fx Standard.
- Find the Relative Strength Index study, drag and drop it on the chart
Or
- Right-Click on a blank part of the chart and select ADD STUDY.
- Under Data Source, you will find a list of charts and studies in the window. Select the one on which you want the new study to be based.
- Under Studies, select the study you want to add to the window. The library of studies will include standard ProphetX studies plus those that you have created. The Most Recent will include studies that you have previously used.
- Under Add To, select the stack you want to add the study to, or select <New Stack> to create a new stack for the study.
- Click OK to exit.
Changing Parameters
Do either of the following to change the parameters:
- For an existing study on a chart, right-click on the study and select PROPERTIES on the pop-up menu, and modify as necessary.
- Right-click on the study name listed in the f(x) docked pane and make the changes in the displayed dialog. Update will save the parameters permanently.