The Price Distribution chart displays the percentage of time an instrument trades at or above a range of prices using inter-day history (daily or weekly). It can also show the percentage of the total volume traded at each price or higher.
To Create a Price Distribution
- Select Charts/Price Distribution from the Main Menu Bar
- Type the symbol for the instrument you want to chart (you can also drag and drop the instrument from the Symbol Search on the left docked tool bar )
- Press the Enter key

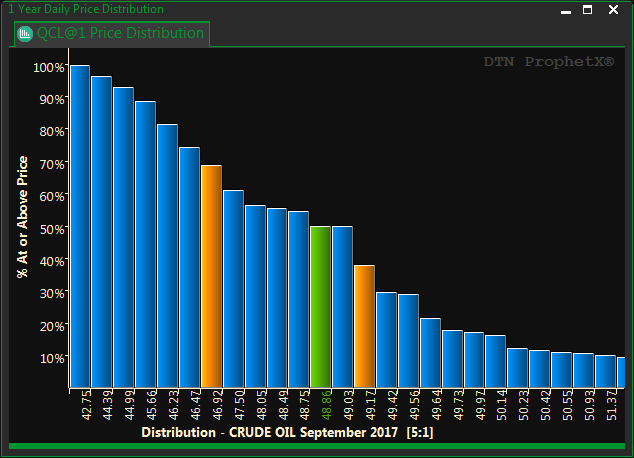
This Price Distribution Chart shows the price of Crude Oil over a one year period using daily data.
- Each Bar shows the Percentage (Y-Axis) of time this instrument has traded at or above this price (X-Axis).
- The Red Bars show the Upper and Lower “Range Markers.” The default settings for these are 33% and 67% and can be changed in the Priced Distribution Global Preferences.
- The Green Bar shows the location within the chart of the instrument’s current price.
- Tool Bar
 Use daily prices
 Use weekly prices
 Compress price bars
 Decompress price bars
 –
–  number of years of prices to show
 Custom time period of prices to show
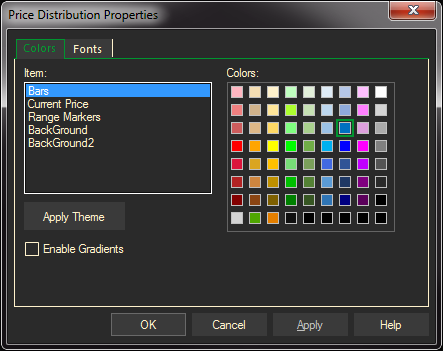
Price Distribution Properties
Colors

Fonts
