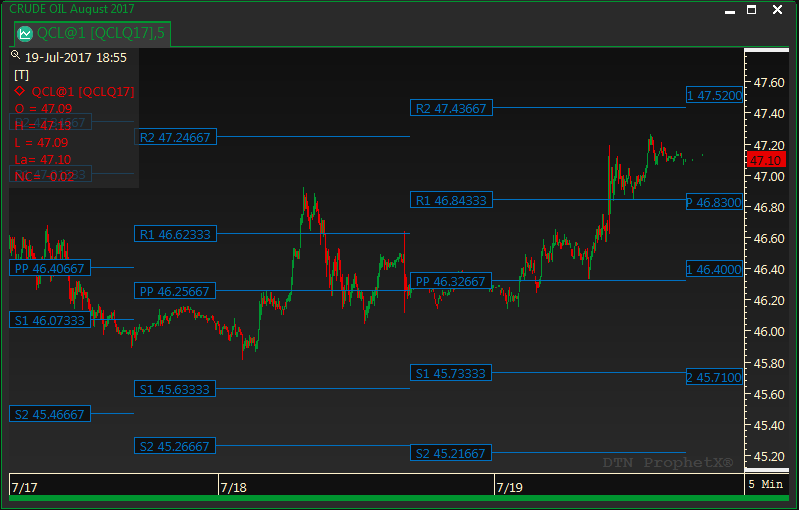
Pivot Points are used to project potential support and resistance levels on intraday charts.
Pivot Point = [Yesterday’s High + Yesterday’s Low + Yesterday’s Close] / 3
Adding the Pivot Points Study to a Chart
- Click on the f(x) Studies docked pane window.
- Click on the plus sign to expand the fx Standard.
- Find the Pivots Points study, drag and drop it on the chart
Or
- Right-Click on a blank part of the chart and select ADD STUDY.
- Under Data Source, you will find a list of charts and studies in the window. Select the one on which you want the new study to be based.
- Under Studies, select Pivot Points
- Under Add To, select the stack you want to add the study to, or select <New Stack> to create a new stack for the study.
- Click OK to exit.
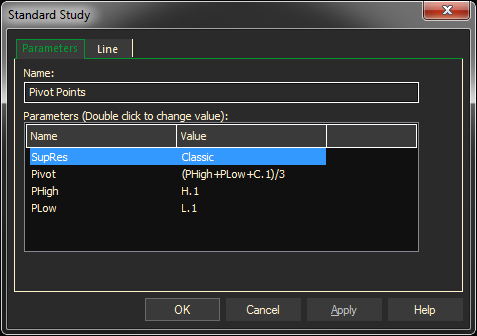
Changing Parameters:
- Right-click on the study and select Change Object Properties
- Select Pivot Points and click OK
- Double-click to select the type of support lines you would like to use with the Pivot Point
- The basic formula is already entered
- Click OK