Percent R measures the latest price of an instrument in relation to its price range over a given number of periods. The %R value is plotted on a scale from 0 to 100 and gives overbought and oversold indications opposite from the Relative Strength Index. Classically, %R values of less than 20 indicate overbought and greater than 80 indicate oversold.
Parameters:
Symbol — data source symbol.
Period — time interval to examine for each value.
Adding the Percent R Study to a Chart
- Click on the plus sign to expand the fx Standard.
- Click on the f(x) Studies docked pane window.
- Find the Percent R study, drag and drop it on the chart
Or
- Right-Click on a blank part of the chart and select ADD STUDY.
- Under Data Source, you will find a list of charts and studies in the window. Select the one on which you want the new study to be based.
- Under Studies, select the study you want to add to the window. The library of studies will include standard ProphetX studies plus those that you have created. The Most Recent will include studies that you have previously used.
- Under Add To, select the stack you want to add the study to, or select <New Stack> to create a new stack for the study.
- Click OK to exit.
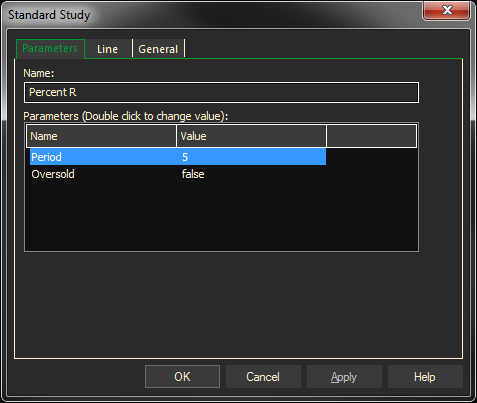
Changing Parameters
Do either of the following to change the parameters:
- For an existing study on a chart, right-click on the study and select PROPERTIES on the pop-up menu, and modify as necessary.
- Right-click on the study name listed in the f(x) docked pane and make the changes in the displayed dialog. Update will save the parameters permanently.