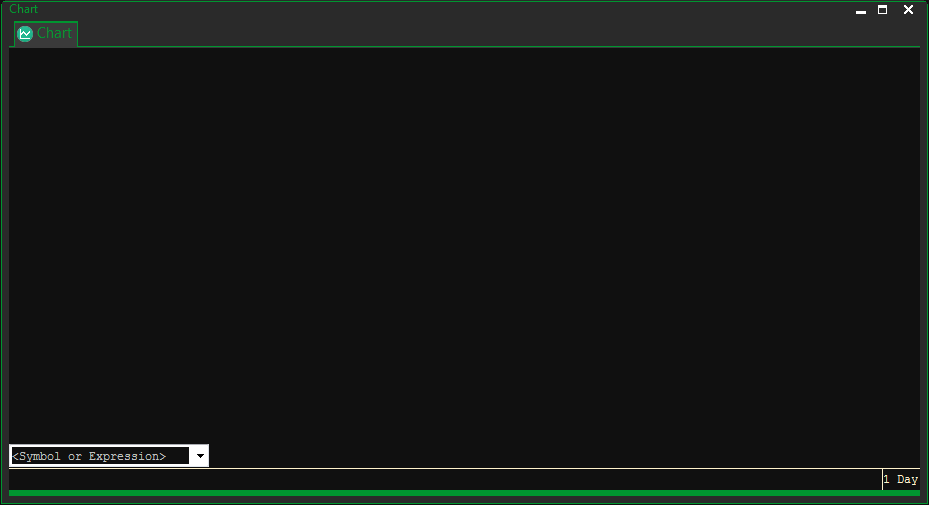
Opening a Chart From the Main Menu Bar
- Select Charts/Chart

Type a base symbol for the chart in the <Symbol or Expression> entry.
Tip: You can also click on the drop-down arrow in the symbol entry area to select a symbol that was previously used.
What you can enter to create a chart:
- A single instrument symbol: For example: QNGZ15 (NYMEX Natural Gas Dec 2015) or MSFT (Microsoft). For help finding a symbol, click on the Docked Symbol Search. Then, drag and drop the symbol on the chart.
- An automatically updating symbol: For a chart that updates as the current futures contract rolls over, type the root symbol of the contract followed by @1. For example: @C@1 for the current corn contract. Use the root symbol followed by @2 for the following month, @3 for the next, and so on. ProphetX will update your symbols automatically as contracts expire.
- A continuous chart symbol: Type the root symbol followed by @C. For example: SP@C. This will chart from today back, all front month contracts, and can be used to determine the most active month of a contract. Colored regions will display the start and end of contract sessions on the X-Axis.
- Forward contract history: can be displayed by typing the root symbol, and @C, then the number of months forward. For example, QNG@C24 will display the prompt months for natural gas, starting with the contract that is trading 24 months out from the current contract. Colored regions will display the start and end of contract sessions on the X-Axis.
- A free-form function: A free-form function combines one or more instrument symbols, mathematical operators, and numbers. You can include plus (+), minus (-), multiplied by (*), and divided by (/). Examples: NGZ6 – NGX6, or WZ6 * 2.
- A pre-defined function: for an instrument relationship or function. You can create an alias identifier to use in place of a function with User Custom Studies. Enter the name of the function in the symbol or expression area.
- A historical chart symbol: Type, in uppercase, the symbol root and the month code followed by the year. For example: CN1999
- Most actively trading symbol: Type the root symbol followed by @A. For example: QNG@A. This will chart the most actively trading futures contract based on yesterday’s volume.
- Sync Pointer: Left click on a chart to enable the pointer to follow your mouse movements. A data window will automatically show data for the date the pointer is on.
- Left and Right Arrows on the Keyboard: will function just like the mouse wheel will to move the chart horizontally.