The momentum study shows the rate of change in a price series for a particular instrument. Taking the current price and subtracting the price a fixed number of intervals in the past calculate each entry.
When prices are increasing, the momentum value is positive. When prices are decreasing, the momentum value is negative. The more rapidly the changes occur, the steeper the slope of the momentum line. As prices increase or decrease at a slower rate, the momentum value will approach zero.
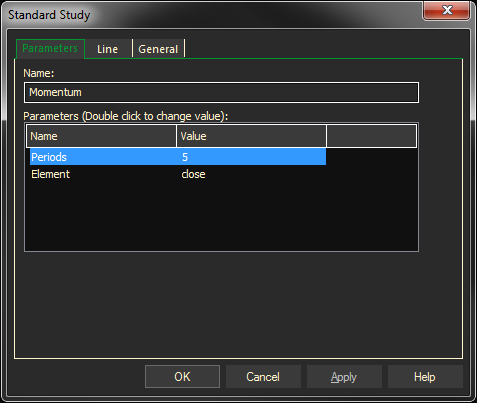
Parameters:
Symbol — data source symbol.
Period — time intervals between the current price and past price.
Element — price field to use for calculation (Close, High, Low, Open)
Adding the Momentum Study to a Chart
- Click on the f(x) Studies docked pane window.
- Click on the plus sign to expand the fx Standard.
- Find the Momentum study, drag and drop it on the chart
Or
- Right-Click on a blank part of the chart and select ADD STUDY.
- Under Data Source, you will find a list of charts and studies in the window. Select the one on which you want the new study to be based.
- Under Studies, select the study you want to add to the window. The library of studies will include standard ProphetX studies plus those that you have created. The Most Recent will include studies that you have previously used.
- Under Add To, select the stack you want to add the study to, or select <New Stack> to create a new stack for the study.
- Click OK to exit.
Changing Parameters
Do either of the following to change the parameters:
- For an existing study on a chart, right-click on the study and select PROPERTIES on the pop-up menu, and modify as necessary.
- Right-click on the study name listed in the f(x) docked pane and make the changes in the displayed dialog. Update will save the parameters permanently.