Market Profile Settings

Profile
- Select TPO, Volume, or Both for the Profile
About Volume Graphics – If Volume or Both (TPO and Volume) is selected a volume graphic will display. This graphic will display, at a glance, the relative volume of trading that each TPO represents. TPO’s will display in different colors. The volume is a represented as a bar extending to the right representing the volume that matches the TPO color. The volume indicates trade count, not the number of contracts traded. Every time a trade occurs, the volume increments by one.
Time Zone
- Select Market or Local Time Zone
Options
- The display can be modified to add or remove TPO High/Low, TPO Counts, TPOs Align, Wide Volumes, Use Colors, High/Low Box, Open & Close, Value Areas, Print Full Range, and Include Bids/Asks.
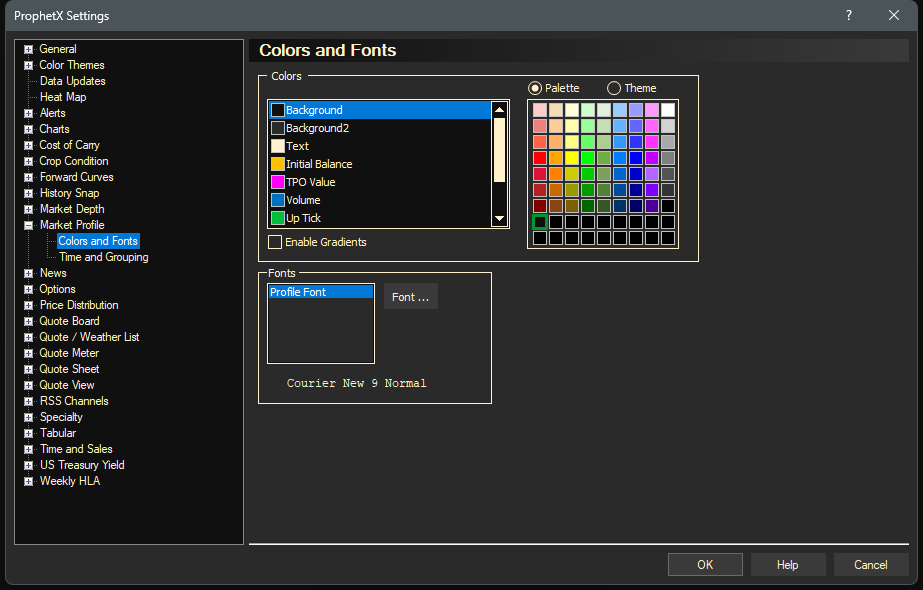
Market Profile Colors and Font Settings
Make selections here to change default colors and fonts.

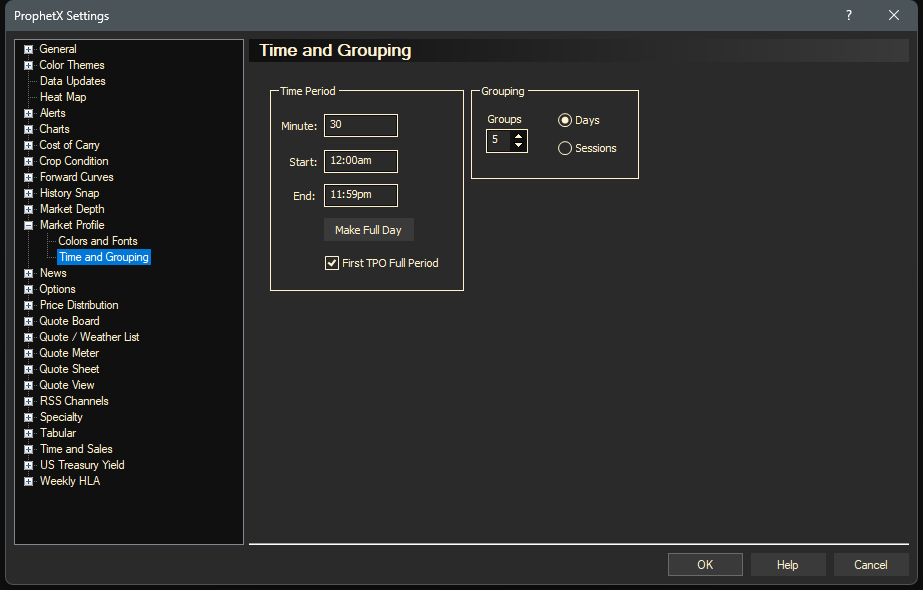
Market Profile Time and Grouping Settings

Time Period
Selections here indicate the time period, hours, and grouping you would like to display.
- Minute – what the display increment will show
- Start and End times
- Make Full Day -display the entire day’s time period
- First TPO Full Period – Show the entire first period of the day
Grouping
- Groups – How many groups of data to display
- Sessions – Show session periods in the above group (example from diagram below – 5 session periods) OR
- Days – Show data for the # of Groups (example from the diagram below – 5 days)