The Market Profile is made up of TPO’s (Time Price Opportunities). A different letter is assigned to each 30-minute time period of every trading session.
the POC (Point of Control) is the row at which the most TPOs occurred.
A value area is calculated using 70% of the days TPOs to give a value area”high” and value area “low”. These values are used as a reference in the following days trading session.
Example of a Market Profile Display
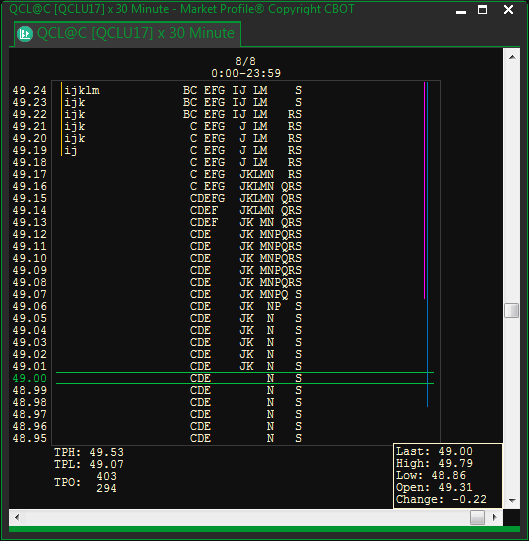
- The left side of the market profile displays prices. In the example above, the current trading value is shown in green. This line will move each time a trade occurs with a different price. The color will change to green or red to reflect the price movement (up or down from the previous trade).
- Each letter, or Time Price Opportunity (TPO), represents a specific half-hour time segment in which that price occurred on that day. When moving the mouse cursor over a TPO, you will see a legend line at the bottom of the screen and it will display Price, Date, Time, TPO, Volume, and the percentage of ticks the TPO has for an entire price bar.
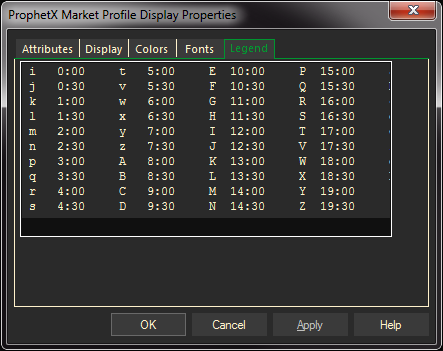
This is also shown in the Legend tab on the Market Profile properties page, which you can open with a right mouse click on the display
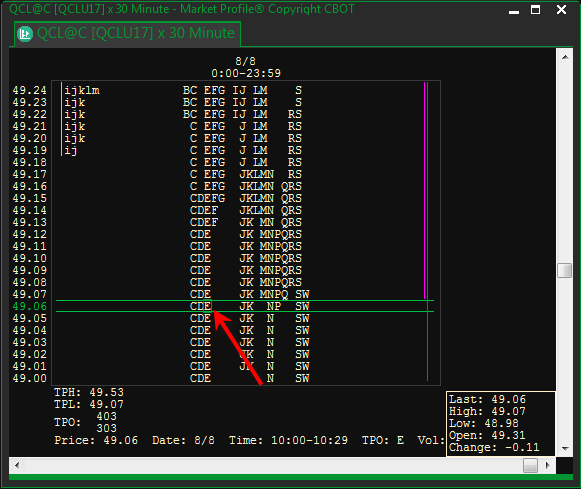
- Click on the letters to split the TPO’s.
Tip: To quickly change the Market Profile symbol, simply type an alpha character and it will take you to the entry box to enter a new symbol.
Before creating Market Profiles, set the default Market Profile settings under File/Preferences.
To Open a Market Profile
- Select Charts/Market Profile.
- In the Market Profile window, enter a Symbol or Expression. As with other ProphetX windows, you may use automatically updating symbols (for example, @C@1 for the current corn contract).
To Customize a Market Profile Window
Change Price Increments — To quickly change the price increments displayed on the left side of the market profile, grab and drag the prices. Or, right-click in the window and select Expand Profile or Condense Profile from the pop-up menu.
Splitting and Merging TPO Groups — To split the TPO groups, right-click on TPO, select Split Group. To Merge, right-click in the day column or on the TPO you wish to merge, next select Move Left or Move Right.
Change Attributes — To adjust the Symbol, Time segment, and the Start and End Time, right-click in the window and select the Properties command. Next, select the Attributes tab and make desired changes.
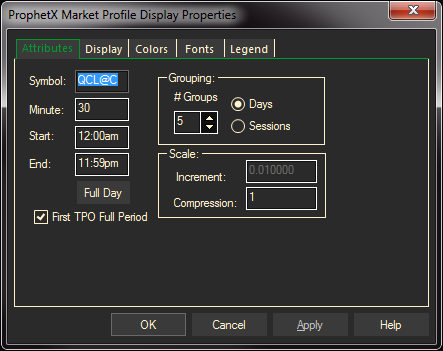
Enter the symbol, the time period for each TPO, the number of groups or sessions and the day start and end.
Scaling indicates how much you want the chart compressed (how many time periods will display.)
Tip: The check box for First TPO Full Period is used mainly for instruments that trade off hours rather than on the hour. If checked it will show that time period the instrument started trading.
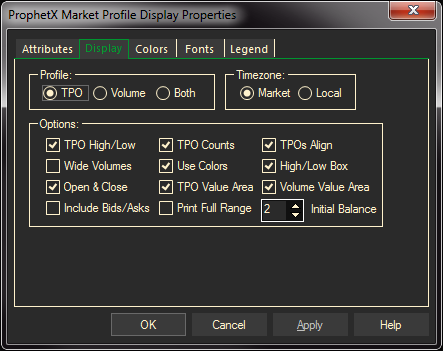
Change Display
- Right-click in the window and select the Properties command.
- Select the Display tab; make the desired changes in the Properties dialog
- Click OK
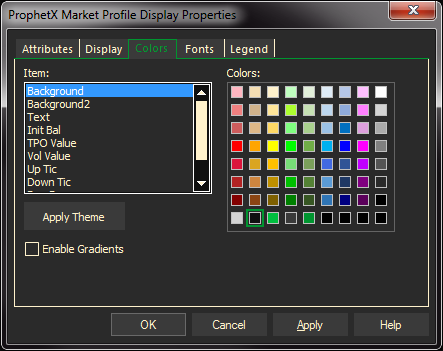
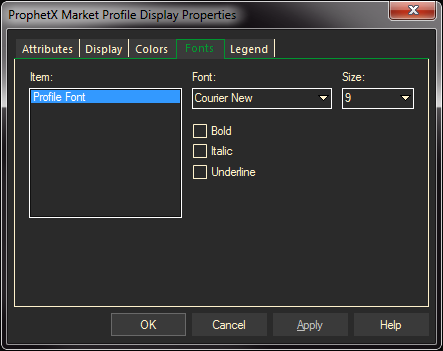
Change Colors and Fonts
- Right-click in the window
- Select the PROPERTIES command.
- Select the Colors tab and make the desired changes.
- Click OK
Volume Graphics
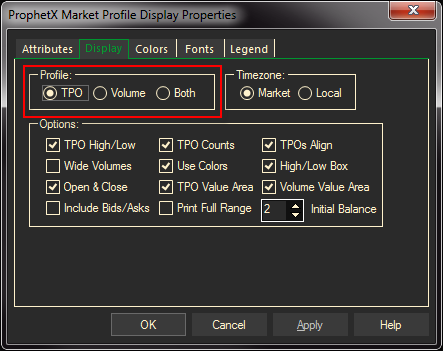
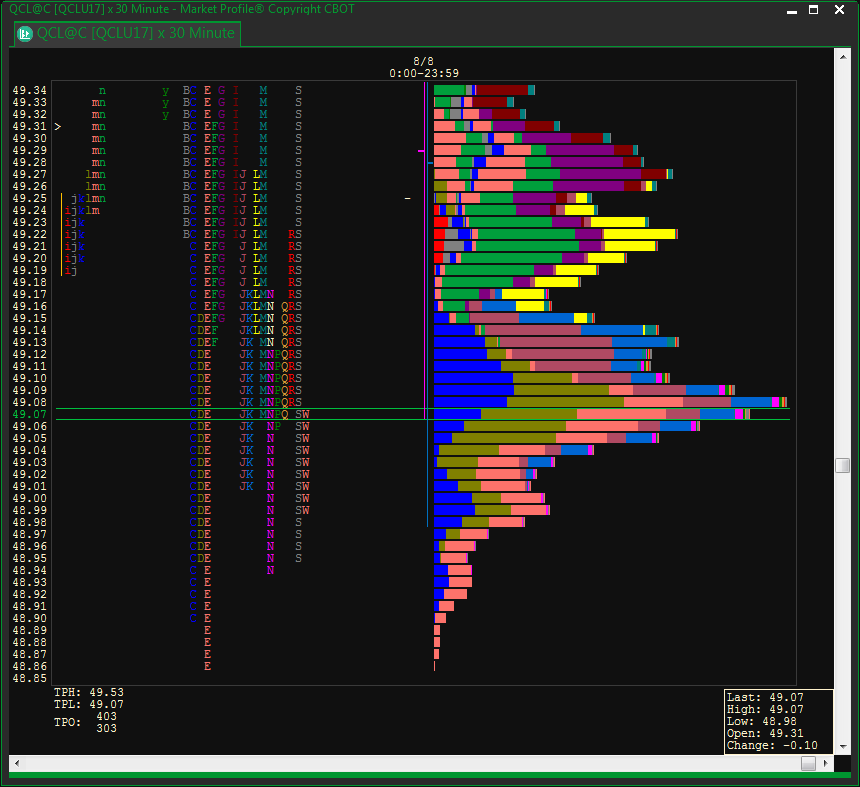
In the Market Profile Properties dialog there is a Profile option. If Volume or Both (TPO and Volume) is selected a volume graphic will display. This graphic will display, at a glance, the relative volume of trading that each TPO represents. TPOs will display in different colors.
The volume is a represented as a bar extending to the right representing the volume that matches the TPO color. The volume indicates trade count, not the number of contracts traded. Every time a trade occurs, the volume is incremented by one.
