The moving average convergence/divergence study, or MACD, displays the difference between two exponentially smoothed moving averages. Two lines are displayed on this study. For each data point on the first line, the slow period average is subtracted from the fast period average. For the second line, the data represented by the solid line is further smoothed using the Smooth period selected.
The MACD study uses three periods: Slow Period for calculating the slow moving average, Fast Period for calculating the fast moving average, and Smooth for calculating the second, dashed line.
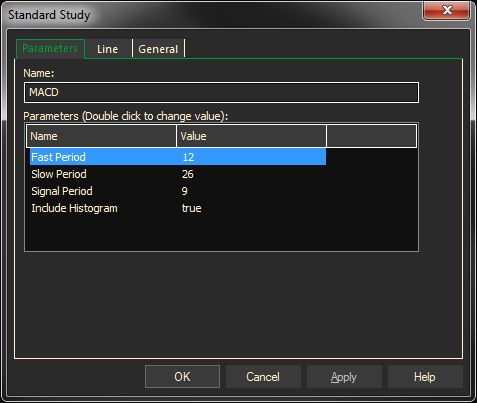
Parameters:
Symbol — data source symbol.
Fast Period — fast moving average periods.
Slow Period — slow moving average periods.
Smoothing Period — moving average period for dashed line chart
Example with defaults: MACD (SP@1, 12, 26, 9)
Changing Parameters
Do either of the following to change the parameters:
- For an existing study on a chart, right-click on the study and select PROPERTIES on the pop-up menu, and modify as necessary.
- Right-click on the study name listed in the f(x) docked pane and make the changes in the displayed dialog. Update will save the parameters permanently.