This will plot the Close price, moving it to the left or to the right the number of periods specified.
Symbol — data source symbol.
Period — number of periods to displace the line. A positive number will move the line to the left, and a negative number will move the line to the right.
Example with Defaults: LAG (SP@1, 5)

Creating the LAG Study
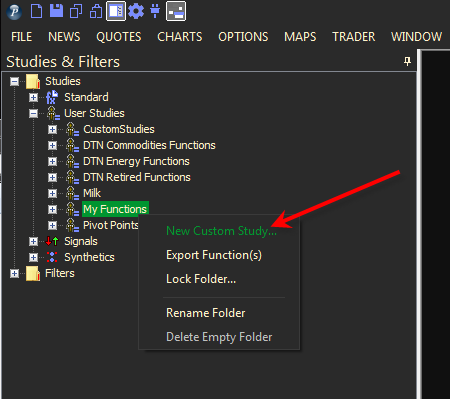
- Right-click on the word User Custom Studies in the f(x) Studies docked pane.
- Select New… The Study dialog box will open.
- In the Name entry of the User Function dialog box, give the study a name
- Type the formula for the study in the Formula entry. If using a pre-defined study, modify it to create the new study criteria. If not using system parameters, delete any parameters listed in the Parameters section. When finished select the OK button. The study will display in your study list and can be added to the chart as outlined above.
- Click OK to exit.
Changing Parameters
Do either of the following to change the parameters:
- For an existing study on a chart, right-click on the study and select PROPERTIES on the pop-up menu, and modify as necessary.
- Right-click on the study name listed in the f(x) docked pane and make the changes in the displayed dialog. Update will save the parameters permanently.