The Keltner Channel is a “channel” study, meaning that it has a high and a low curve.
The high and low curve are formed by either Adding or subtracting the same value from a central reference curve.
If the BandMethod is set to “1” the Range will be calculated as the maximum of Absolute value
-
(High – Previous Bar’s Close)
-
High – Low
-
Absolute value (Low – Previous Bar’s Close)
The center reference curve is formed by first taking:
-
(High+Low+Close)/3 then applying a moving average to that series
To that we either add/subtract the following to create a channel:
-
(High-Low) Moving Average of that data series
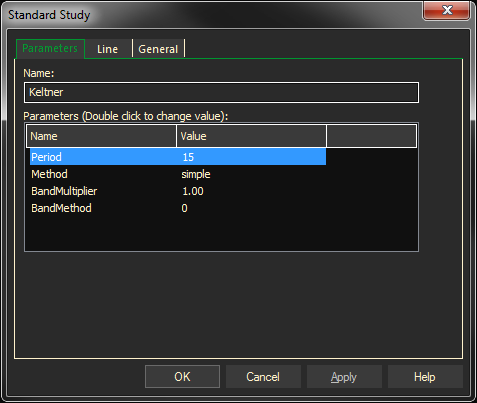
Parameters:
Symbol – data source symbol
Period -The number of bars in a chart.
Example with defaults: Keltner(SP@1, 10)
Another example: Kelt Up (SP@1, 10)
Another example: Kelt Lo(SP@1, 10)