You can view data in a chart window by moving the x-axis in three different ways:
Click or Drag the Scroll Bar
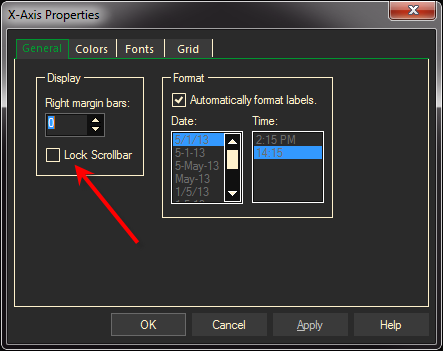
Horizontal scroll bars are an optional display that let you quickly view different sections of a chart. Take the following steps to add or remove the scroll bar:
- Right-click on x-axis and select X-Axis Properties
- Under the General tab, click on the Show Scroll bar check box, then select OK.

Drag the X-Axis
You can also move a chart display to the left or right. Place your pointer on the chart and left-click, the pointer will turn into a hand icon, now drag it left or right.
Use Your Keyboard
- Press the Home key to jump to the beginning (most recent data) of your chart
- Press your End key to go to the data at the end.
- Press Enter to revert back to the original chart positions
Use Your Mouse
Place your mouse on a blank area inside the chart window. Press and hold your left mouse button to drag the contents of the window in any direction. To return the data to its original location, press your Enter key.
Use the Context Toolbar
The Context Tool Bar is located at the bottom of the window frame. The F2 key toggles the toolbar off or on. The “arrow” buttons on the right side of the tool bar are used:

The first icon will be to Scroll to the Beginning of the Chart or to the Far Left.
The second icon is to Scroll back a section at a time.
The third icon is to Scroll forward a section at a time.
The fourth icon is to Scroll back to the End of the chart or to the Far Right.
Note: The scroll buttons are disabled by default. To enable go into Preferences, click on the “+” next to General, and select Context Bars. Select Chart from the available list and scroll down to enable them in the second column.