HLC Channels are an alternate chart type in ProphetX. This Chart Type was developed by DTN is currently patent pending.
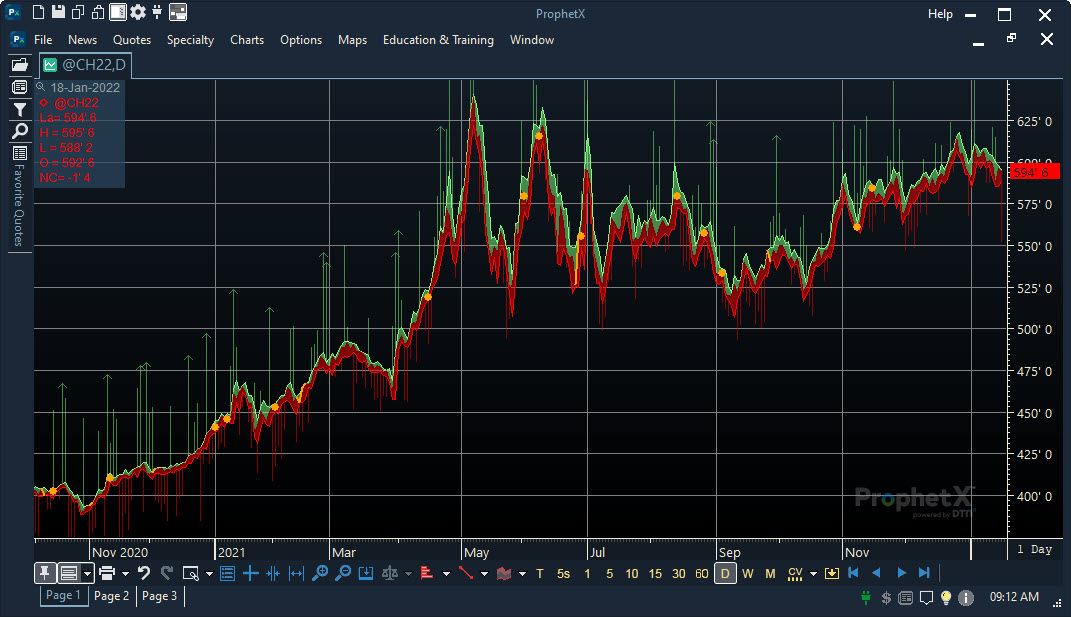
The purpose of an HLC Channel chart, is to show the High, Low and Close values of the entire series rather than as individual displays. Basically, this chart is a combination of three separate line charts for the High, Low and Close. The chart shades the area between the close and high value in one color and the area between the close and low value in another color. The actual close value is where the two colors meet.
Click Here to watch a short video about the HLC Channels
The following indicators can be added to the chart. (These are turned on and off in the General Settings):
- Volume Tails showing when the trading volume exceeds a given percentage over or under a specific moving average period. The tail length represents the percentage of volume compared to the Average. Volume increase of more than 100% are shown with an upwards arrow.
- Body Ratio Markers can be added (The orange dot on the chart example below). These show instances where the difference between the Open and Close prices is small.
- Boundary Close Lines reflect consecutive periods in which the close value is within a configurable percentage of either the High or Low value.
Example of an HLC Channel Chart
Changing your Chart to an HLC Channel Chart
-
- On any chart, there will be a docked toolbar at the bottom. If you can’t see this tool bar press the F2 key on your keyboard
- Look for the Line Type Icon
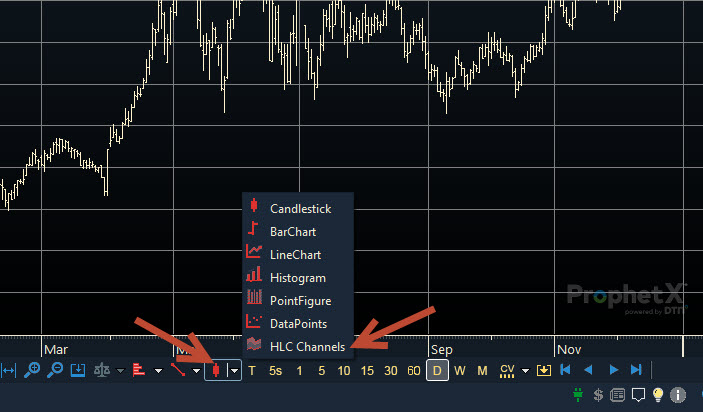
- Click on the blue arrow next to the icon to view the list of Line Types available
- Select the HLC Channels to apply to the current chart
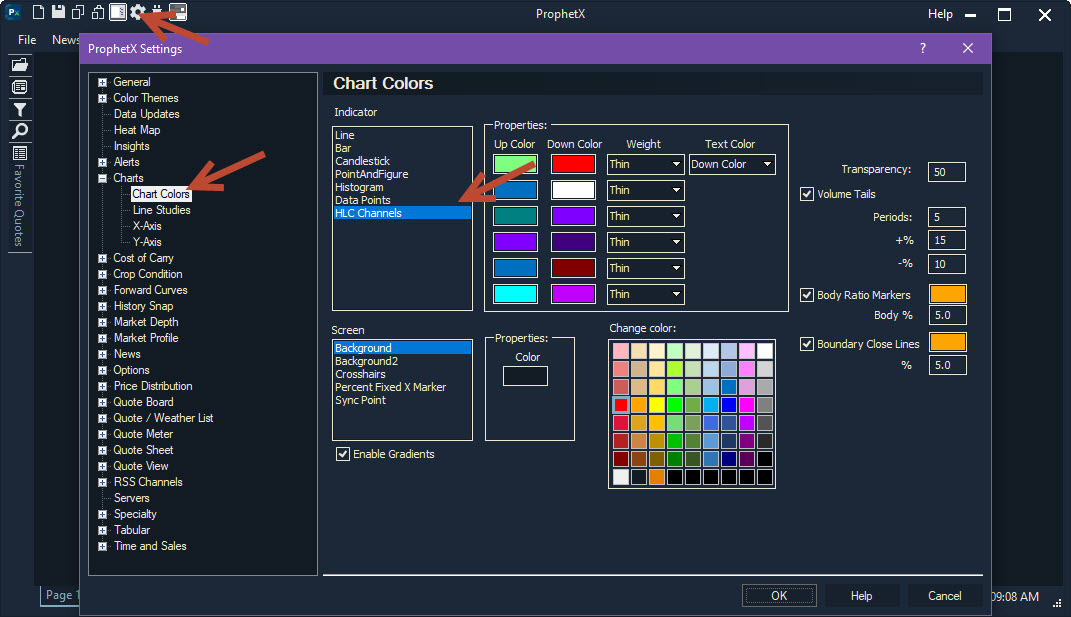
Changing the General Settings
- On the top menu bar, click on the Wheel icon
- Click on the + sign next to Charts
- Click on Chart Colors
- In the box under Indicators, click on HLC Channels
- On the right hand side of the display, you will be able to change the settings for the Volume Tails, Body Ratio Markers and Boundary Close Lines.