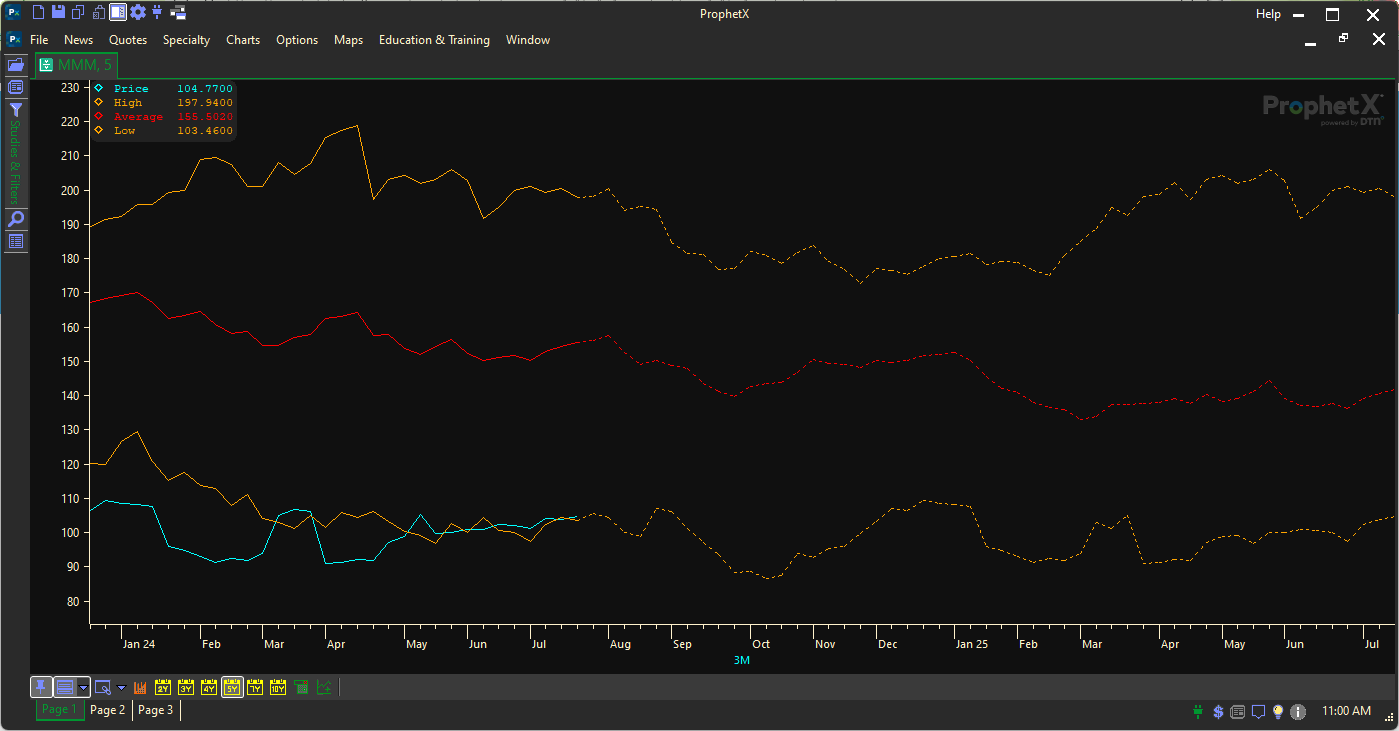
The Year over Year Weekly Display shows the weekly price and calculated High, Low and Average prices going back year over year for a selected number of years. It can be easily customized using the Context Toolbar located underneath the display.
To bring up the display
- Go the to Main Menu, and under Charts, find Weekly HLA

- Enter the symbol into the Chart and hit Enter on your keyboard
- Here is an example of what the Chart will look like:

Context Tool Bar
![]()
Starting with the Orange Icon, here is the list of button Functions:
- Grid Toggle – Changes the display from a graph to a tabular display and back again.
- The 2, 3, 4, 5, 7 and 10 year buttons will change the number of years displayed
- 5 years is the default.
- Exclude Date Range – Provides settings for ranges of dates to exclude from calculations
- Overlay Year Line – Provides options to display Year lines
**Note: Most Active (@A) symbols are not available on this display
**Note: Data window will show dashes when no data is available.