ProphetX has 3 new studies that offer a quick glance to see if the competition is widening or narrowing the basis. It shows traders when the downtrend or uptrend in IV has been broken. This is a key edge for all traders.
-
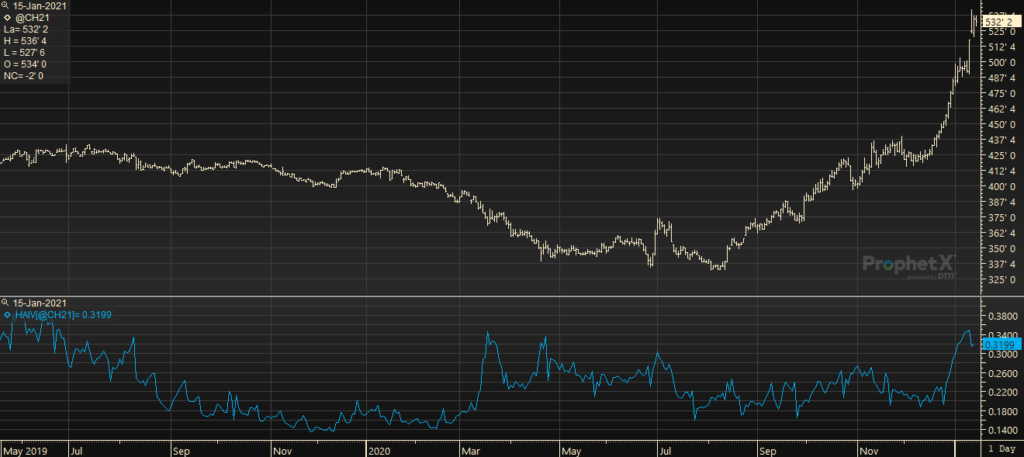
Historic IV Average
-
Our DTN Expert’s Gold Standard. A 3-month average of 2 in to 2 out of the money strikes
-
-
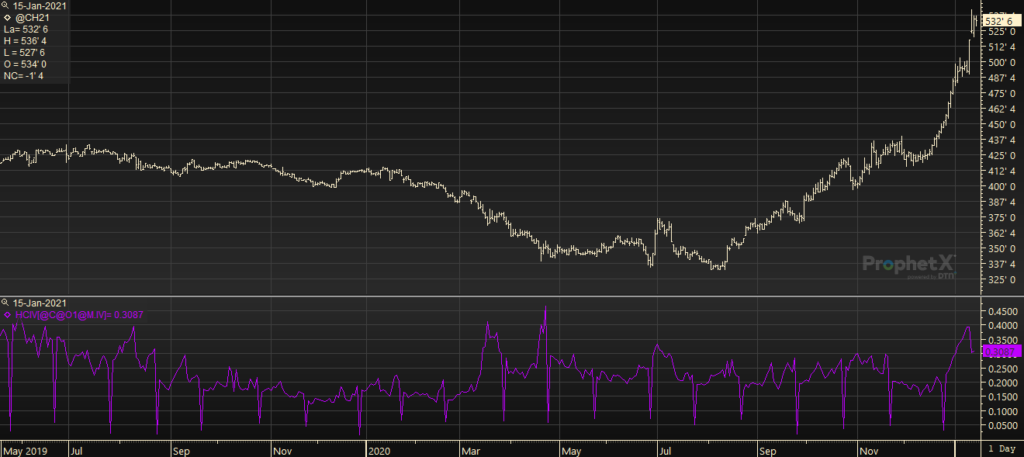
Historic IV Continuous
-
Historic IV of a continuous contract, single or relative strike
-
-
Historic IV Strike
-
Historic IV of a single relative strike
-
Click Here to watch a short video about the Historical Implied Volatility studies.
Example of a Historic IV Average Study on a Chart
Example of a Historic IV Continuous Study on a Chart
Example of a Historic IV Strike Study on a Chart
