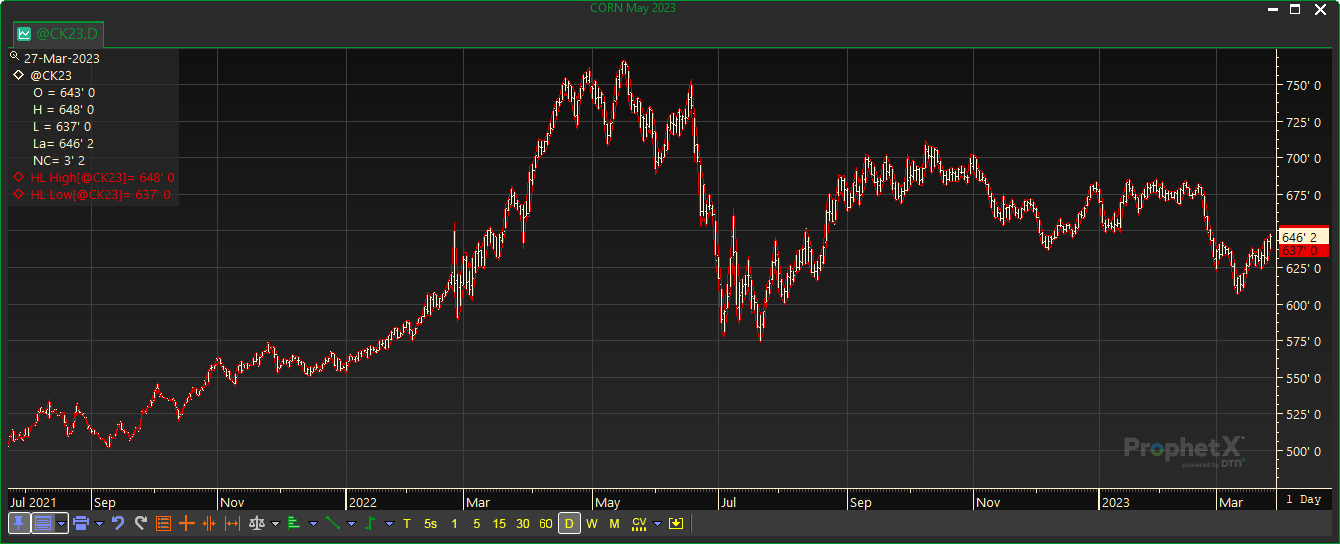
The High_Low study plots the High and Low of the contract and adds a band study. The study allows for shading between the High and Low lines.

Changing the parameters
- Right-mouse click anywhere on the chart and select Change Object Properties
- Under Charts, select High Low
- Click OK
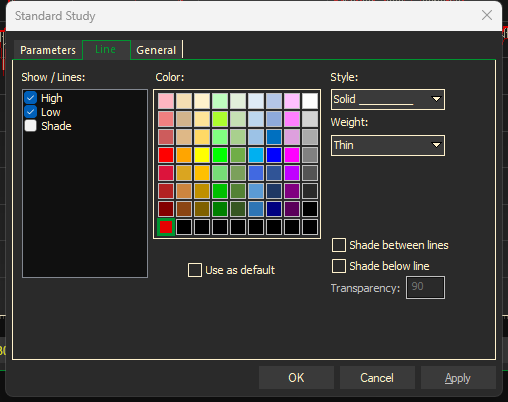
- Click on Line Tab
- Select the High or Low line, or Shade
- Change the Color or the Shade transparency
- Click OK
