Unlike historical charts, Forward Curves display all of the selected forward contract months along the X-axis. Each data point represents one of the forward contract months. The Y-axis represents the price of that contract on the day selected when the chart was generated.
The display is dynamic and updates when current prices update.

This example shows all the current price on all future contracts for Natural Gas. The Chart was created on August 8th, 2017.
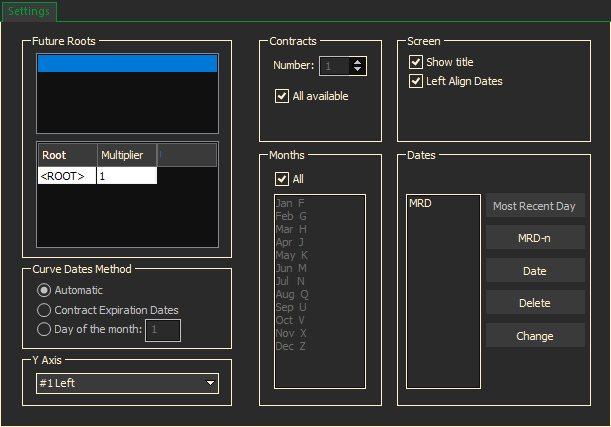
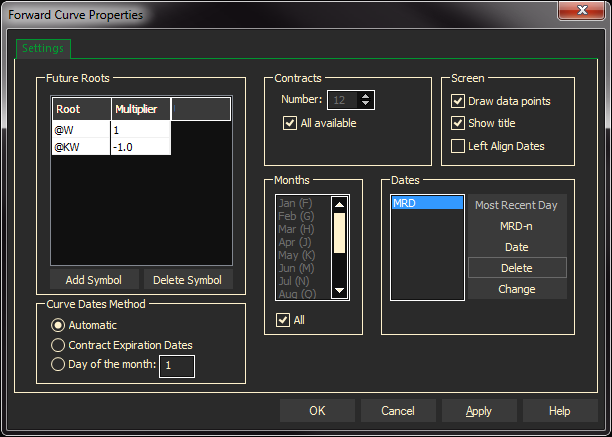
To Create a Forward Curve
- Select Chart/Forward Curve from the Main Menu Bar
- Enter the symbol root in the Future Roots section
- Contracts – Select the Number of Contracts to be used for this chart. The default is All available. To specify the number of contracts that should be included in your Forward Curve chart, click to de-select the “All available” check box. Then select the number of months from the box above it.
- Screen – To further modify what is to be included in the chart, make selections in the following fields:
- Show title – The default will show the title of the Forward Curve chart. To hide the title, click to clear the Show title box.
- Left Align Dates – lines up all expired and forward contracts on the left most date – if not checked expired contracts will display under their respective dates in history.
- *Note – Changes in version 4.9: Draw data points can be turned on for all future Forward Curves from the General Settings.
- To turn on Data Points for the current chart:
- Right click on the appropriate line to open a menu
- Select Line Properties
- Check Draw Data Points
- Select either Apply or OK
- To turn on Data Points for the current chart:
- Months – Select the Contract Months to be displayed. The default is All months. To specify which months should be included in your Forward Curve chart, click to clear the All check box, then select individual months from the box above it.
- Dates –
- Click on the Most Recent Day button to chart the most recent day in history.
- Click on the MRD-n button to display prices for a day before the MRD date. For example if you want to display the forward curve from a week ago, enter MRD-7. This will add another line to the chart showing what the forward curve 7 days ago.
- Click on the Date button to display the curve on a specific date. This will allow you to display a historical forward curve – for example, what curve for that product looked like a year ago.
Ex:
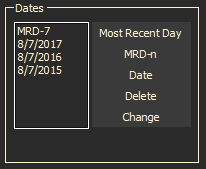
- Click on the Delete button to delete any of the dates that are highlighted.
- Click on the Change button to change any of the dates that are highlighted.
- When finished entering all the forward curve criteria, click the OK button.
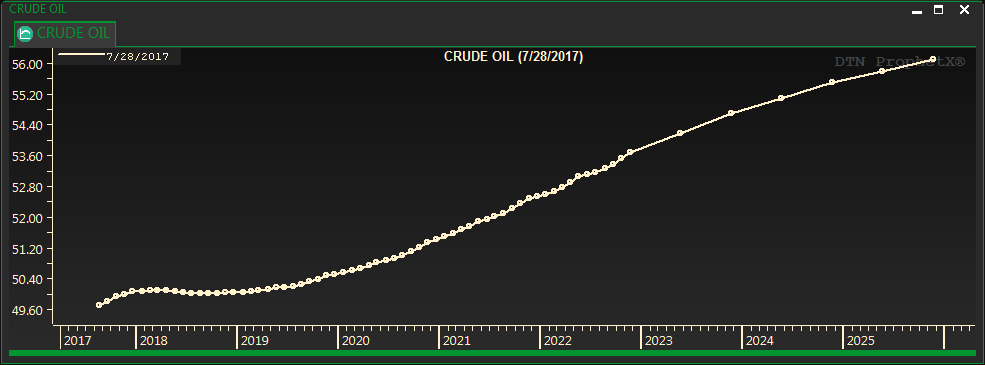
Understanding the Forward Curve Display
When you move your cursor to each data point the Quote Window pop-up displays the contract month and price. The prices are also displayed on the left.
Historical Forward Curves
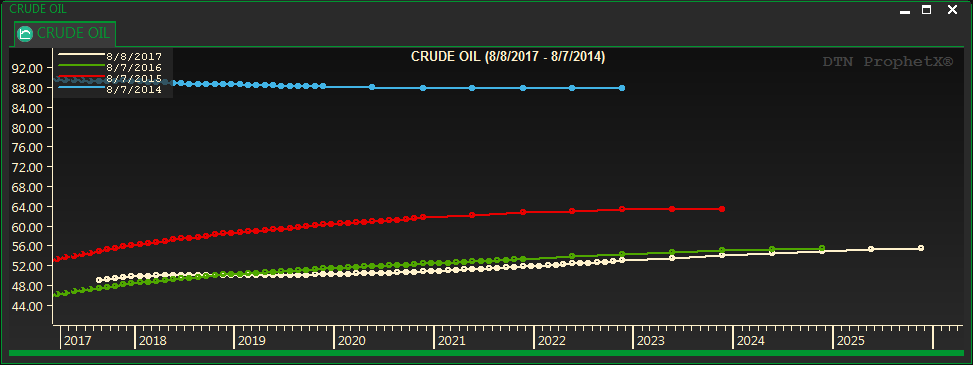
Historical forward curves show the prices on the same contracts at a previous date in history.
To create historical forward curve:
- Right click in the current forward curve display and select Date (or create a new forward curve)
- Change the date to another date in history such as the same day last year
- Repeat this process for each year you want to add to the curve
- When finished, click on Apply and OK
If an instrument is still trading and has expired contracts, the expired contracts will display with dotted lines. The example below is showing crude contracts that were trading in 2017, 2016, 2015, and 2014.

Creating a Forward Curve With a Synthetic Function (Spreads)
By defining a synthetic function you can create forward curves for spreads, cracks, crushes, etc.
Just define the contracts and enter the root symbols and the appropriate multiplier. ProphetX will create the curve for you.
The example below shows the curve of a spread between Chicago and Kansas wheat contracts: (@w@1-@kw@1)
The minus sign on KW indicates subtract.
Additional examples of using synthetic functions

Example of a spread between the 5 and 10 year treasury notes. (@FV@1*15)-(TY@1*10)
(15 parts of the five year – 10 parts of the ten year)
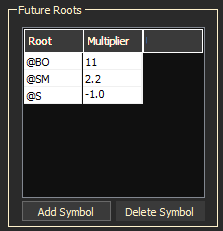
Example of a soybean crush. (@BO@1*11)+(@SM@1*2.2)-@S@1
(11 parts of bean oil +2.2 parts of soy meal -1 part of soy beans)
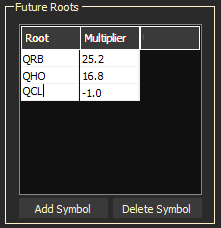
Example of a 532 crack. (((3*QRB@1)+2*QHO@1)*42-(5*QCL@1))/5
(3 parts of RBOB (unleaded gas) *42 and divide by 5 = 25.2
Plus 2 parts of heating oil * 42 and divide by 5 = 16.8
Minus 5 parts of crude / 5 = 1
Using the synthetic function table above, you can only add and subtract. Therefore, the formula must be broken down piece by piece to determine the multiplier entries, as shown in the 532 crack above.
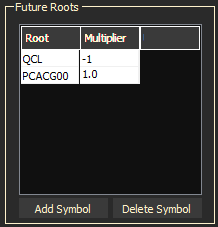
Example of a forward curve spread between the cash and futures prices for WTI Crude. This will subtract the futures crude prices from the current spot price.
Tip: Code the future symbol first.
By default, forward curves update every 10 seconds.
Forward Curve Properties
Right-click in the Forward Curve display and select Graph Properties to change the Color selections and Fonts’

Select the display area and color.
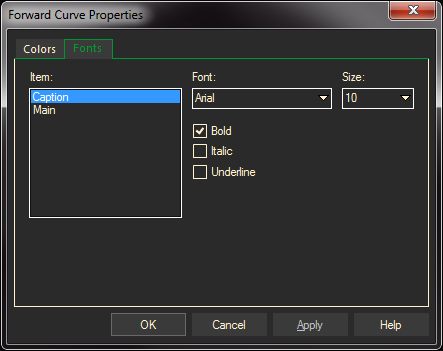
Select the Forward Curve caption or main font and their appropriate font selections.
