The Contract Average study is used specifically with a monthly continuous chart. It will average the prices from the previous contract’s expiration date to the current contract’s expiration date.
- Create a monthly continuous chart or tabular display
- Right click and select Add Study, or click on the f(x) Studies button the docked toolbar
- Select Contract Average from the studies list and select where you want the study line to be placed – on the same chart stack or on a new stack.
- Click OK
On a daily continuous, the study line will be horizontal for each day in the contract month.
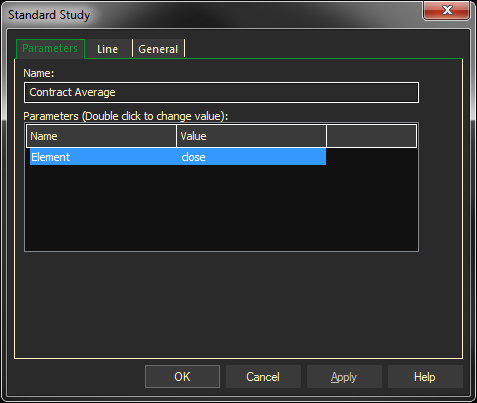
Parameters:
Symbol — data source symbol.
Element — price field to use for calculation (Close, High, Low, Open) => (0,1,2,3)