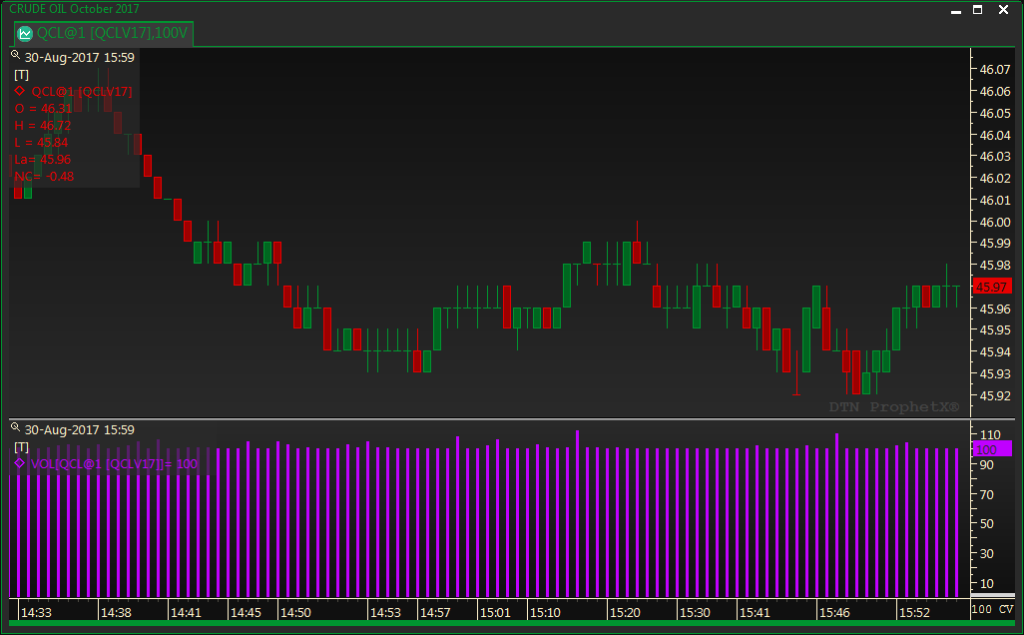
Constant Volume Bars draws a new bar or candle when a specified number of futures contracts are traded.
The Constant Volume display has a range of valid intervals that can be used to display the chart. The range of valid intervals is based on the symbol.
Changing symbols will change the valid range. This requires that charting sometimes adjusts the current interval to match the new symbol. When this happens, the changed interval will be displayed with a yellow background to alert the user.
There are several cases when this can happen:
- If you enter an interval that is outside the valid range. The interval will be adjusted to the closest value within the valid range.
- If you switch to a new symbol and the current interval is outside the valid range. The interval will be adjusted.
Once the chart is displayed, both the current interval and the optional custom interval will be remembered for the rest of the current session of that chart.
Switching back to a previously displayed symbol will restore it’s previously used selected and custom intervals.
These intervals will not be saved in workbooks.
To activate Constant Volume:
- Open a chart
- Add the Volume study to Stack 2 on the chart
- Click on the drop-down arrow next to the Constant Volume button
- Select one of the tick selections or create your own using custom
The chart and volume will change accordingly.

Ex: If you chose 100 trades per bar, if a trade occurred that made the total tick volume over 100 it will either add the extra 50 trades to the same bar as shown in the example below or start a new bar, which will always show 100 trades in each bar, as shown in the example above: