Comparison charting compares two or more instruments and/or expressions. Then, you can quickly do a spread, average, or comparison ratio on them with just a click of a button rather than manually creating a user-defined function each time you want to compare data on several instruments. In addition, the Focus List that attached itself to the chart can be pre-loaded with symbols to make the use of comparison charting more efficient.
To Create a Comparison Chart:
- Build a chart with the first instrument
- Right-click in the chart and select Add Symbol
- Enter the symbol or expression and select the appropriate Y-scale.
- Continue this process until all instruments have been added to the chart or add the symbols via the Focus List as shown below.
To do Comparisons:
- Click on the diamond shape in the quote window on the first instrument.
- Click on the diamond shape in the quote window for the second instrument.
- Small squares will display on the chart lines/bars to indicate they are activated.
- The Comparison Charting button will also activate.
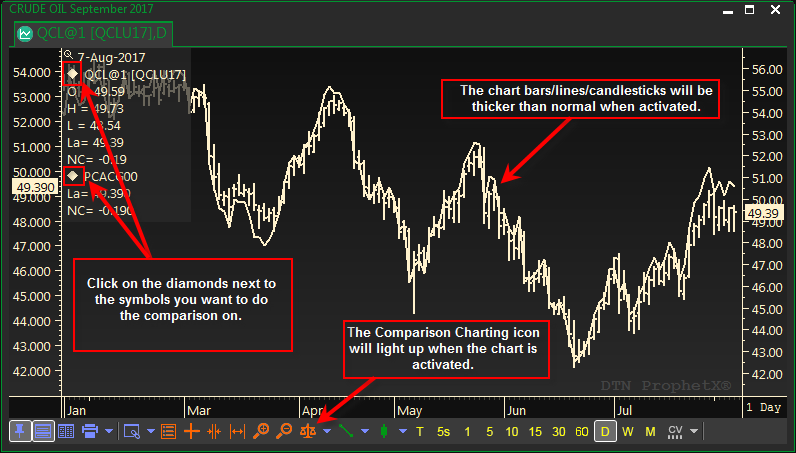
- Click on the drop-down arrow next to the Comparison Charting button and select the function/s you want to perform on the selected instruments.
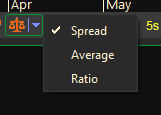
To Add an Average, Spread, or Comparison Ratio:
- Click on the “scales” button on the chart context tool bar as shown in the diagram above and select what you want to display in the chart.
- You can add all three selections if you’d like – just click on the “scales” and make your selection.
- If you want to save the symbol or expression as a User Custom Study to be used in other charts, click on the Save as User Customer study button.
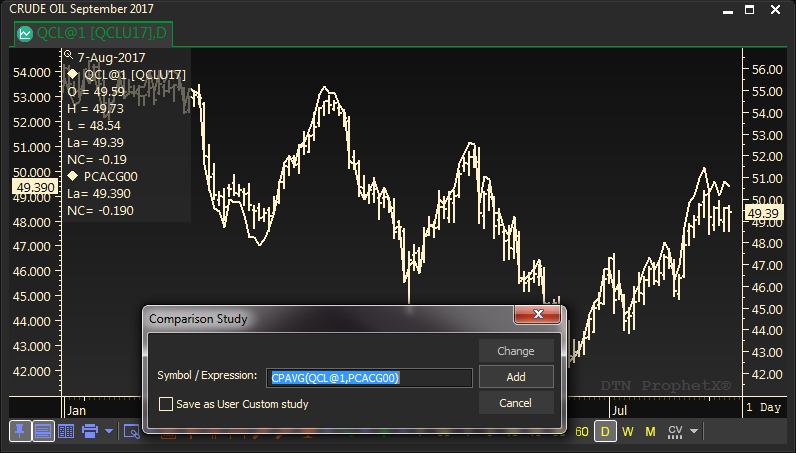
The Spread and the Ratio will be created as separate lines at the bottom of the chart.
The Average will be added to the chart itself.
Editing the Chart Data:
- Right click on the chart line you want to change and select Edit Symbol/Expression.
- Click on Save as New.
Tip: It matters which order chart lines are selected to represent the order the symbols are placed in the Spread and Ratio calculations.
Ratio – A:B or A/B: The fist symbol selected will be the antecedent (A) and the second symbol the consequent (B). So it doesn’t matter which is the Base symbol or which was added to the chart first; it matters which chart line is selected first and second.
If you create two ratios, selecting in each order, you will see two graphs with one being the inverse of the other.
The same thing applies to spreads – when you select the chart lines, the first will be subtracted from the second.
Focus List
The Focus List allows you to add, delete, and change symbols within a chart. It is automatically created every time you create a new chart. As you add symbols they are added to the chart and the Focus List. Individual symbols, as well as entire quote lists can be added to the Focus List. The value of this display is that you can do comparisons between several symbols by
Adding or deleting instruments from the Focus List as needed.
The Focus List can be opened on a new blank chart or along with a current chart.
To Add Symbols
Use the Focus List to add symbols:
- Click on the Focus List button on the Context tool bar on your chart.

(Press the F2 key to activate the Context tool bar) - Right click in the Focus List and select Add Symbol and enter a quote symbol.
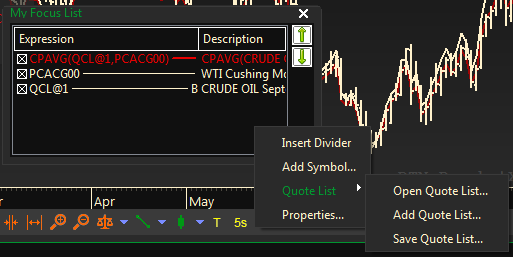
Select Open Quote List to add saved list of quotes:
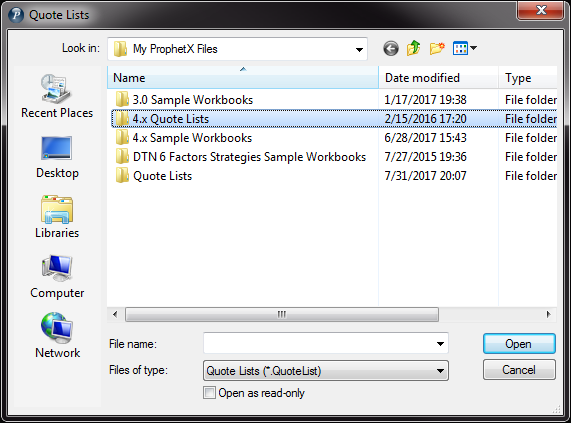
- When selecting Quote List, navigate to My ProphetX Files.
- Select Quote Lists and select the quote list you want to Add.
- Click OK
- The symbols will be added to the Focus List. To activate them and add them to the chart click on the check box next to the symbol/s you want added to the chart.
- Insert Divider will allow you to add a divider between symbols in the quote list. This is helpful for charts that user different instruments within the same chart when doing comparison charting.
Use the Symbol Search to pre-load the Focus List
- Create a chart
- Left-click on the Focus List button on the Context Tool Bar at the bottom of the chart
- Left-click the Symbol Search button on the Docked Toolbar on the left side off the ProphetX window
- Drill down to find the symbols you want to use
- Highlight the symbols and then drag and drop them on the open Focus List
Formulas
You can also enter formulas into the Focus List. There are several ways to do this:
- Right click in the list and select Add. A dialog box will display. Type your formula and click on Add.
You can also save the formula as a custom study — click to check the box next to Save as User Custom Study. - When using comparison charting, you can also add the formula shown in the dialog box. When added to the chart it will also be added to the Focus List.
To Delete Symbols From the Chart
- Open the Focus List and uncheck the instrument
OR
- Right click on the line and select Delete – this will not delete the instrument from the Focus List – it just removes it from the chart until you recheck it in the Focus List to add it back.
To Change Symbols or Formulas
- Open the Focus List
- Right click on the symbol or formula and select Edit
- Make your changes and click on Change.
- You can also save the formula as a User Custom Study. It will be saved in your default Study list and can be retrieved at any time for any reason.
Quote Lists
Open a Focus List and right click. You will see options to populate the Quote List with a current Quote List from ProphetX, Add a Quote List to the Focus List, or Save all the symbols and expressions in your Focus List to a new Quote List.
Open Quote List – will navigate to My ProphetX Files for you to select the Quote list you want to populate the Focus List.
Add Quote List – will navigate to My ProphetX Files for you to select the Quote List to add a Quote List to whatever is currently on the Focus List.
Save Quote List – will save all the symbols and expressions you currently have in the Focus List.
Divider
The Divider selection allows you to place a divider between your most common symbols or expressions and the others you don’t use as often but may need at a later time.
Properties
The Properties selection allows you to change the Focus List font.