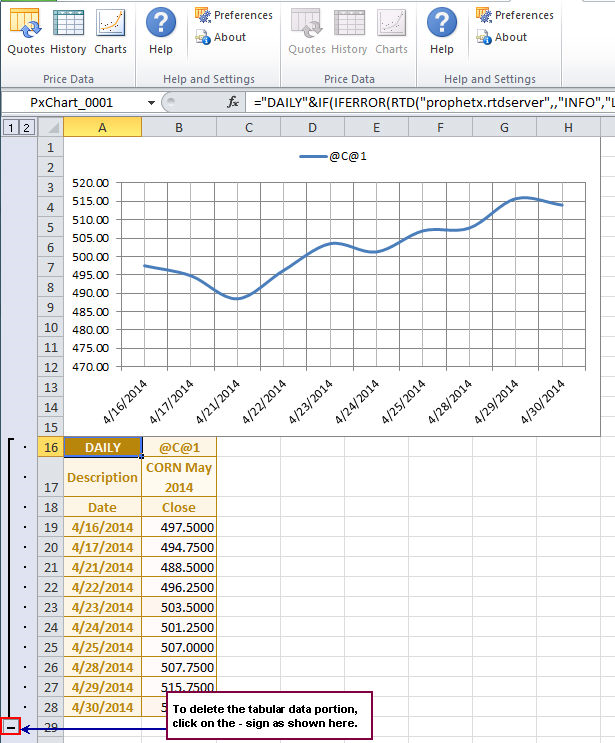
The ProphetX Excel Add-in charting feature will chart historical data and show the “tabular” information at the same time.
The charts can be displayed in various intervals and selected order.
Creating a chart is very similar to retrieving history:
- Select the Charts button.
- The charting dialog box will open.
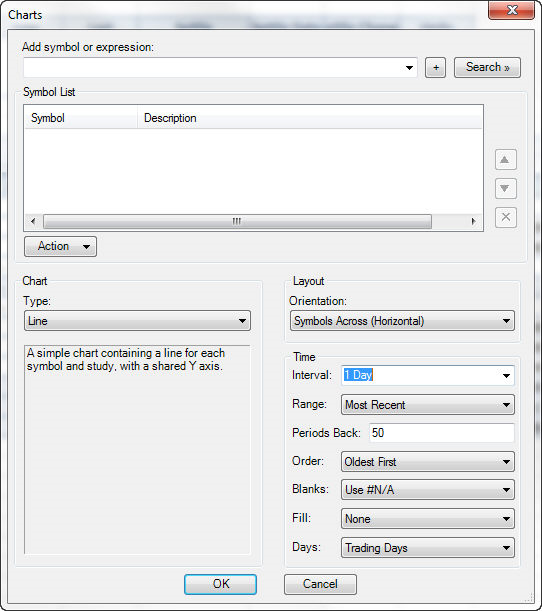
- Add Symbol or Expression: type the symbol or expression and either click on the + button or press Enter to add it to the Symbol List. The drop-down arrow in the entry area also lists any previous symbols or expressions that were used for history. Or, look up the symbol by clicking on the Search button. (The Symbol Search works just like the Symbol Search in ProphetX – the only difference is that after you highlight the symbols you want to use, click on the Add button to add them to the symbol list). – To enter a futures chain, enter the root symbol followed by a space and the number of contracts you want to include. Then press either the F3 key, Enter key, or the + icon button. The generated symbols will use the @1 @2 @3 notation.
- Symbol List: to edit the symbol list, select a symbol and use the up/down icon buttons to change the order of the symbols, or the “X” icon button to delete. You can right-click the symbol and select an action to perform on the selected symbol (see Action Button below for more information).
- Action button: allows you to add additional information to the data you are retrieving and is described in detail under Symbol and Action Button.
- Chart Type: Once the symbols are in the Symbol/Description area, you will select the Chart Type you want to display – line, performance, bar, bar + study, candlestick, or candlestick + study. When you make a selection, the description under the chart Type will display telling you about the type.
- Layout: specifies whether you want the field orientation to display vertically or horizontally.
- Time: determines the historical interval you want displayed.
- Interval: prices retrieved or either daily, weekly, monthly, or intraday periods of 1, 5, 10, 15, 30, or 60 minutes.
- Range: allows the selection of the amount of data to retrieve.
- Most Recent: retrieves X number of prices from the current day. Enter the number of prices to retrieve i the “Periods Back” field.
- Fixed Range: retrieves a fixed number of prices from a Start and End date. Note that the End date can be in the future and the prices will fill in as the current date approaches the End date. Enter the date range in the “Start” and “End” fields.
- Expanding Range: the prices retrieved “expand” as new prices update. Note that this will overwrite the rows beneath the range as the new prices are updated. Enter the date/time to begin the range in the “Start” field.
- Expand on Close: the prices retrieved “expand” as the closing price is updated for the current day. Ideally used for daily futures prices when waiting for the Settle price. Enter the date/time to begin the range in the “Start” field.
- Order: selects the order to sort the data as “Newest First” or “Oldest First.”
- Blanks: when blank prices appear in the range, this setting allows selection of how it should be displayed. Blank prices can appear for many reasons: when showing weekends and holidays and the chosen instrument does not have prices for these days, the instrument may not trade during the select time period, etc.
- Show as “—“: this is the original ProphetX method of showing blank data. We kept this method because some users may have written routines that respond to this method.
- Leave blank: nothing is displayed.
- Use #N/A: this is the Excel method of showing blanks. When creating an Excel chart, this method will ignore the blanks in the chart. The other two methods will show a 0 (zero) value for the price.
- Fill: when blank prices are encountered, they can be filled in with existing prices,
- None: leave blank.
- Fill Forward: fill the blank prices with the previous price, but will not fill in future prices. For example, you select a Fixed Range of prices that contain future prices … those that range past the current date/time. Those future prices will remain blank until that date/time has passed.
- Fill Forward Extended: fill the blank prices with the previous price, and fill in future prices. For example, you select a Fixed Range of prices that contain future prices … those that range past the current date/time. Those future prices will be filled in with the most current price available.
- Fill Backward: fill the blank prices with the following price.
- Days: allows the trading days to be changed.
- Trading Days: display the exchange trading days/hours for the instrument.
- Weekdays with Holidays: display all weekdays (Monday-Friday) including holidays.
- Calendar Days (7-day): display all days including weekends and holidays.
Click on OK when finished making all entries.
Note: You can drag columns and rows in the spreadsheet to resize the chart.
The Action button can be used to change the display using Currency Conversion or Unit Conversion. (Click on the hyperlinks for detailed information on each.)
Example of a chart:
Changing the display
Once you have the data in your spreadsheet, you can quickly edit it.
- Double-click on the column heading in the upper left cell in the tabular display portion. (in the example above it’s “Daily” label)
- The dialog box for the display will open up and you can change any attributes you currently have, as well as add new ones.
Note: To manually adjust RTD links, refer to RTD Linking History.