Adding or Deleting Grid Lines
You can add or remove the vertical and/or horizontal grid lines in your chart.
- Right click on the X-axis and select X-axis Properties.
- Select the Grid tab
- Check the “Show” check box to show the grid lines or uncheck the box to remove the grid lines
- Click OK to finish
Vertical Grid Lines (Charts)
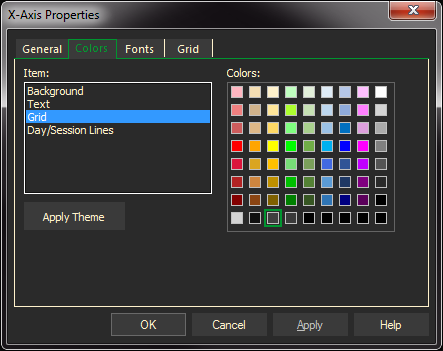
Changing Vertical Grid Line Colors
- Right-click on the X-scale and select X-axis Properties
- In the Properties dialog, click the Colors tab
- Select Grid and then select the color
- At any time, select Apply to make and view changes while the dialog remains open . To exit, do either of the following:
- Select OK to apply changes and exit.
- Select Cancel. Only changes made before clicking Apply will remain.
Horizontal Grid Lines Charts
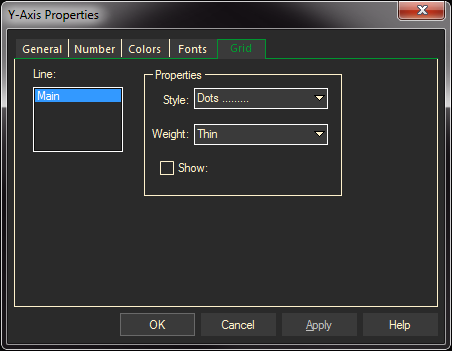
Changing Horizontal Grid Lines
- Right-click on Y-axis text and select Y-scale Properties.
- In the Properties dialog, click on the Grid tab.
- Click on the arrows to the right of the Style and Weight boxes to view choices. Click to select the ones you want.
- Click the Show box to turn grid line display on or off.
- At any time, select Apply to make and view changes while the dialog remains open. To exit, do either of the following.
- Select OK to apply changes and exit.
- Select Cancel. Only changes made before clicking Apply will remain.
Note: Changing the properties on individual pages will over-ride selections in the Preferences.