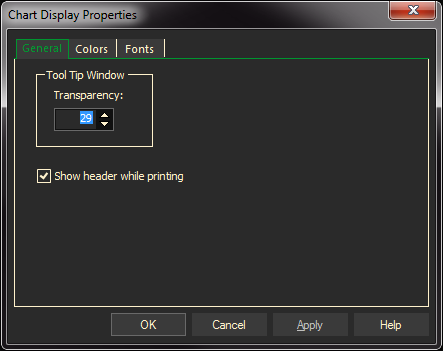
The basic chart properties page is shown below. Some chart types have specific properties and will be described on a separate page with the appropriate dialog box for those properties

You can set the transparency of your Tool Tip that displays when you move along the chart. Some users like to have am opaque tool tip while other like a more transparent one so they can see the chart bar underneath.

The Colors tab allows you to change the color of the background and text of the tool tip.

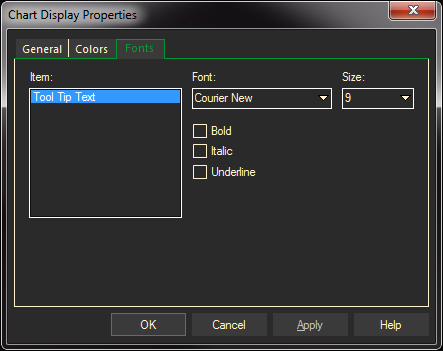
The Font tab lets you change the font in the tool tip.
Chart Stack Properties
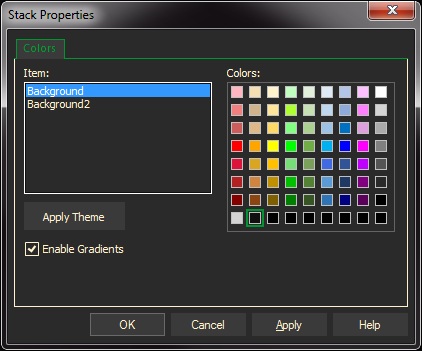
This dialog box opens when you right-click in a chart and select Stack Properties. With this dialog you can change the background colors for a single chart or a chart that has multiple stacks in it.
Stack Properties
Stack Properties change the background color of the chart or stack if there are multiple stacks in the chart.
- Right-click inside the chart stack, then select Stack Properties
- In the Stack Properties dialog, select the Colors tab.
- Select the Background (chart background or Background2)
- Click on the color from the list of Colors.

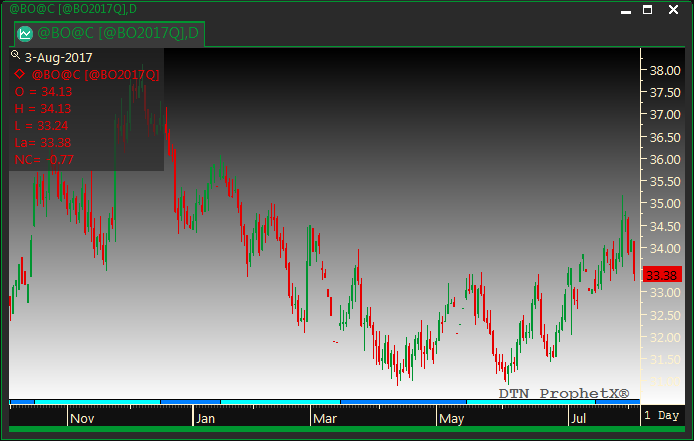
The Enable Gradients check box with display the background in a gradient format like this:

At any time, click Apply to make and view changes while the dialog remains open. To exit, do either of the followings:
- Click OK to apply changes and exit.
- Click Cancel. Only changes made before clicking Apply will remain.
When you change stack background color, the background color for the corresponding Y-Scale will change to match it. Subsequent charts will also open with your new background color.
Tip: You can also set the background color in the Chart Settings under General Preferences global preferences.
Note: Changing the properties on individual pages will over-ride selections in the Preferences.