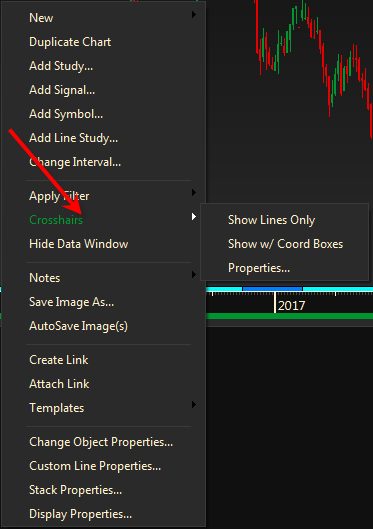
Adding a Chart Data Window and Cross Hairs to a chart lets you more accurately determine values at any point in it. These are independent displays and can be used together or separately.
By default the Chart Quote Window displays when you create a chart.
A Chart Data window gives you a readout of values for all chart lines, and line studies that intersect any time slice in your chart. Cross hairs permit easier reference to values shown on the x-axis and Y-Scale and elsewhere in the chart.
Tip: On line studies, when cross hairs intersect a line study, the angle noted in your data window will be the apparent angle of the line study as it currently appears on your screen.

Adding or Deleting Cross Hairs
- Right-click in an empty area on the chart
- Select Cross hairs/Show Lines Only or Show w/Coord Boxes.
- You can also select the Cross hairs icon on your Context toolbar.
Moving Cross hairs
When cross hairs first appear, their point of intersection will follow the movement of your pointer until you click the mouse to anchor it.
To move the intersect point later, do any of the following.
- Click anywhere in the chart.
- Press the left and right arrow keys on your keyboard.
- Drag the intersect point. When it is in the desired position, click to anchor it.
Tip: The sensitivity of your mouse may affect cross hairs. If they do not anchor with one click, try double-clicking.
Chart Data Window Default
You can choose to have the chart data window automatically added to each chart you open.
- In the Preference display click on Charts to set this and other general defaults.
Showing or Hiding the Data Window
- Right-click in an empty area on the chart and select Show or Hide Data Window
Moving a Data Window
The Data Window can be moved to anywhere in the chart. Just place your pointer on the window and drag it to the desired location.