The chart colors are customizable with the use of several right mouse click menus. Right Mouse click anywhere in the chart and then select the Property you would like to change.
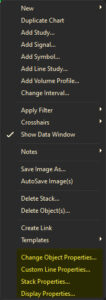
Change Object Properties
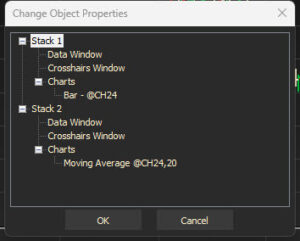
In this menu, you can select the portion of the chart you want to customize. Each symbol and stack on the chart will be reflected and can be customized individually.
- Click on the object you want to customize
- Click OK
- Another window will come up with all the properites that are customizable for that object
Customize Line Properties
You have the ability to add a Custom Line to the chart complete with its own label.
- Under Lines > Labels:, click Add
- Double click on [Blank] and type in text
- Make other changes as desired
- Click OK
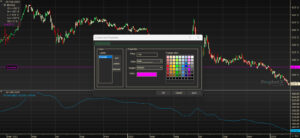
Stack Properties
If you have multiple stacks on your chart, each can be customized.
- Right mouse click on the chart you want to customize
- Select the colors you want
- Click OK
- You can go back to the normal chart colors by clicking on Apply Theme
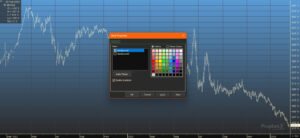
Display Properties
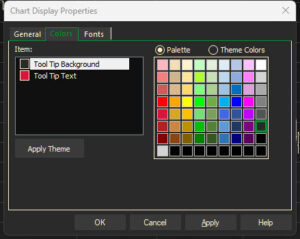
You can customize the colors and font of the Tool Tips that appear on the chart by using this menu.
Y-Scale text — Right-click on the Y-Scale text, then select Y-Scale Properties. Format the colors, fonts, numbers, as well as how how the prices in the Y-Scale are displayed.
X-Axis text color — Click on the x-axis text, then select X-Axis Properties. Format the colors, fonts, date and time formats in this display
Tip: Changing the properties on individual pages will over-ride selections in the Preferences, but only for this current chart.