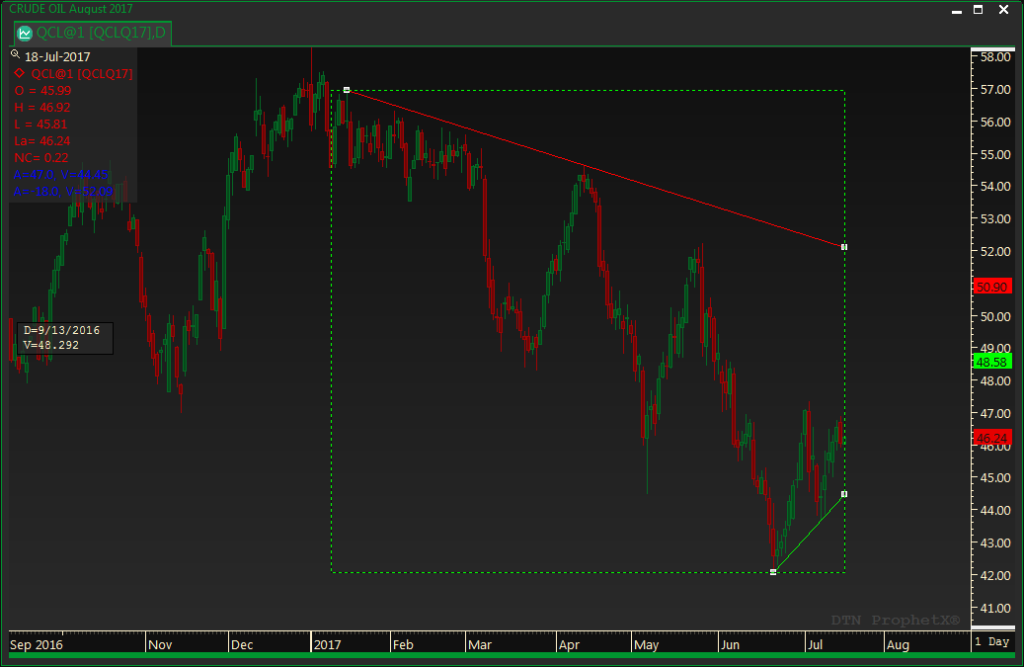
This indicator automatically displays the slope over a specified number of candles as a trend line, either along the highs or lows depending on preference.
The uptrend line connects the lowest low in the user specified period with the next lowest low preceding the highest high for which the trend line is not penetrated.
The down trend line connects the highest high in the period with the next highest high preceding the lowest low for which the down trend line is not penetrated.
Adding the Automatic Trendline Study to a Chart
- Click on the f(x) Studies docked pane window.
- Click on the plus sign to expand the fx Standard.
- Find the Automatic Trendline Study, drag and drop it on the chart
Or
- Right-Click on a blank part of the chart and select ADD STUDY.
The Add Study dialog box will open.
- Under Data Source, you will find a list of charts and studies in the window. Select the one on which you want the new study to be based.
- Under Studies, select the study you want to add to the window. The library of studies will include standard ProphetX studies plus those that you have created. The Most Recent will include studies that you have previously used.
- Under Add To, select the stack you want to add the study to, or select <New Stack> to create a new stack for the study.
- Click OK to exit.
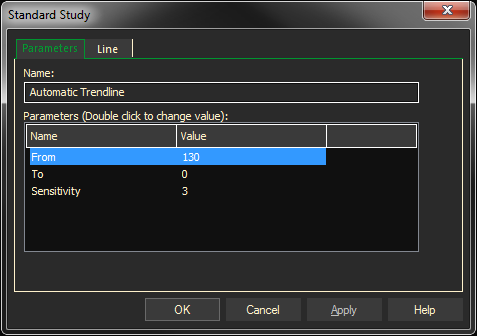
Changing Parameters
Do either of the following to change the parameters:
- For an existing study on a chart, right-click on the study and select PROPERTIES on the pop-up menu, and modify as necessary
- Right-click on the study name listed in the f(x) docked pane and make the changes in the displayed dialog. Update will save the parameters permanently.