The Average Directional Movement Index (ADX) provides, on a scale of 0 to 100, a moving average (smoothed version) of the DMI.
Example of Chart with the ADX Study
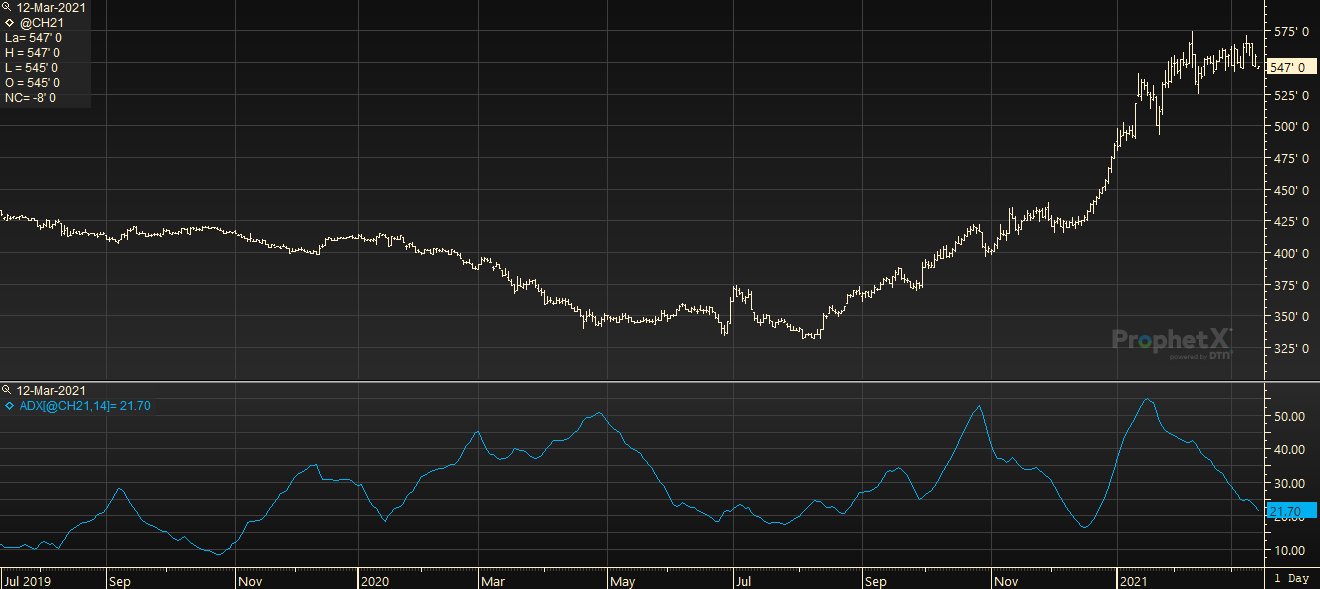
The higher the ADX, the more the instrument is trending. If an instrument is trending, it becomes a good candidate for trend-following studies. If an instrument is not trending, it may be better suited to another type of study. The ADX can also be used to compare several instruments to decide which is trending and which is non-trending
Parameters:
Symbol — data source symbol.
Periods A range of the users market cycle.
Example with defaults: ADX (SP@1,14)
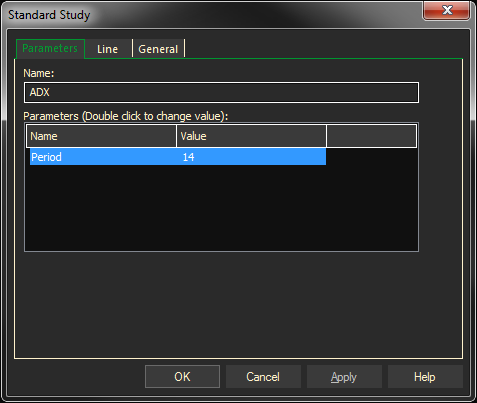
Changing Parameters
- Do either of the following to change the parameters:
- For an existing study on a chart, right-click on the study and select PROPERTIES on the pop-up menu, and modify as necessary.
- Right-click on the study name listed in the f(x) docked pane and make the changes in the displayed dialog. Update will save the parameters permanently.