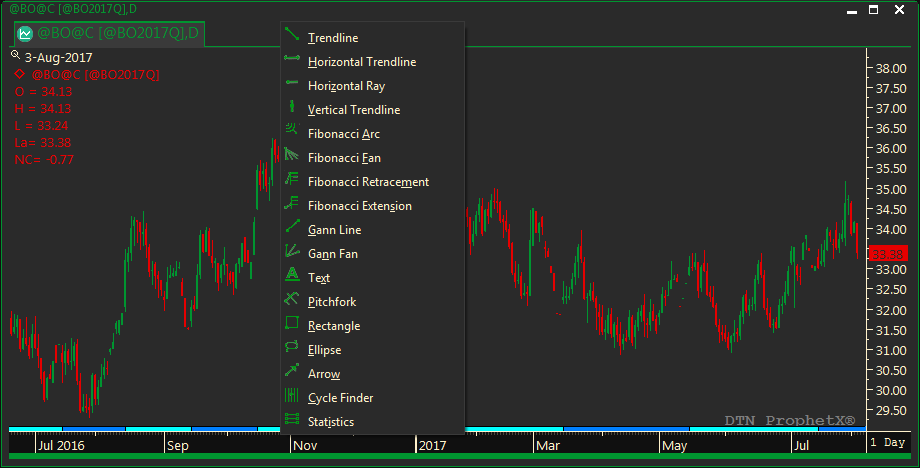
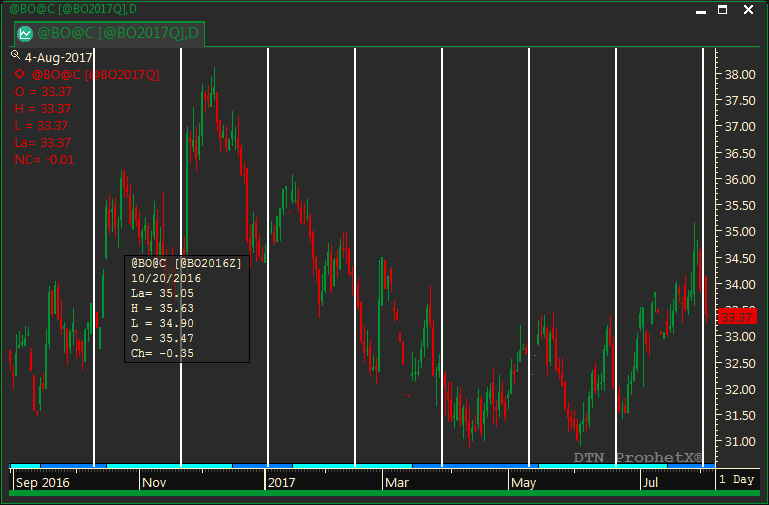
Identify a deviation in a cycle pattern and forecast the next cycle into the future on a chart. To add a Cycle Finder to a chart window, first display the Context toolbar.
On the Context toolbar at the bottom of the chart, click on the Cycle Finder icon, and then follow the instructions below. (If not showing, press F2 to turn on the context toolbar.)

After you click on the Cycle Finder icon ![]() , click anywhere on your chart and the first line of the Cycle Finder will appear. Move the mouse left or right to move the plot lines equal distances apart.
, click anywhere on your chart and the first line of the Cycle Finder will appear. Move the mouse left or right to move the plot lines equal distances apart.

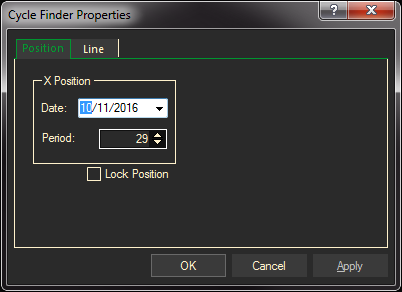
Changing Cycle Finder Position Properties
- Right-click on the Cycle Finder Bar, select Cycle Finder Properties.
- Select the Position tab. You can select a new X Position Date and period. Click on the arrows to the right of each text box, and make a selection from each list.
- Click OK to exit.

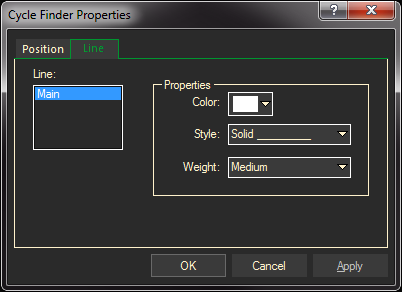
Changing Cycle Finder Line Properties
You can set the color, style, or weight of the Cycle Finder lines. Click on the arrows to the right of each text box, and make a selection from each list.
- Click OK to exit.
