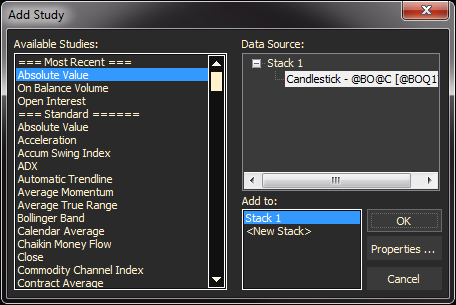
A chart study is a function attached to the base chart of your window that uses markers, text, graph coloring, and alerts to indicate when conditions you have specified are met.

To Add a Study do either of the following:
- Right-click on a blank spot in the chart, then select Add Study
- In the Add Study dialog, select a study, specify where to add the study (Add to:
- Click OK.
OR
- On the Studies Docked Tool bar, select the Study, then drag and drop it on the chart.