The accumulation swing index provides a cumulative total of the swing index. The Limit Move parameter allows you to adjust limit move prices based on the positions of decimals in your data files.
Example of an Accumulation Swing Index Study 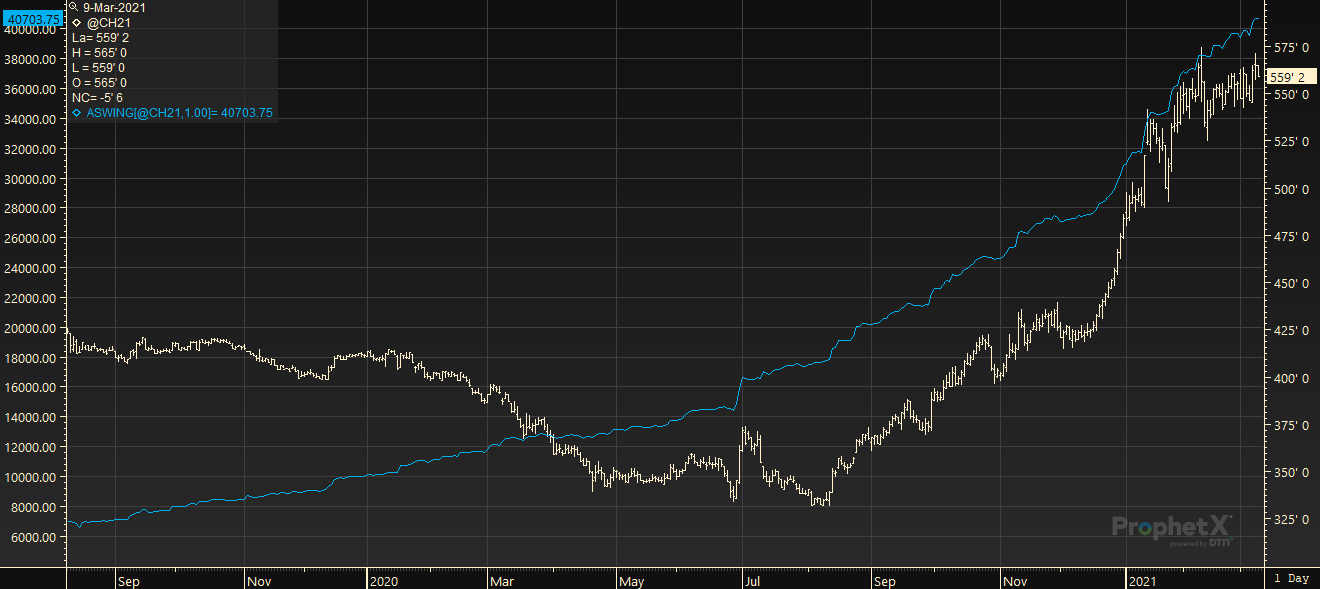
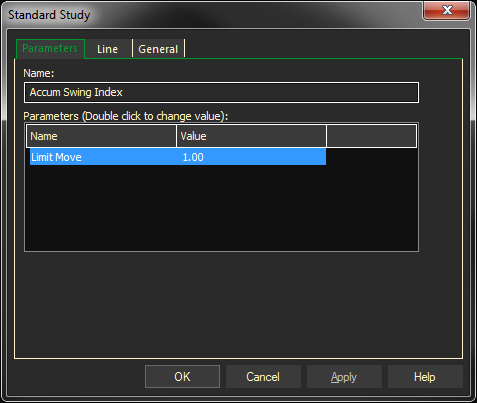
Parameters:
Symbol — data source symbol.
Limit Move — source limit move price.
Example with defaults: ASWING (SP@1, 1.0)
Adding the Accumulation Swing Index Study to a Chart
- Click on the f(x) Studies docked pane window.
- Click on the plus sign to expand the fx Standard.
- Find the Accumulation Swing Index study, drag and drop it on the chart
Or
- Right-Click on a blank part of the chart and select Add Study.
- The Add Study dialog box will open.
- Under Data Source, you will find a list of charts and studies in the window.
- Select the one on which you want the new study to be based. Under Studies, select the study you want to add to the window.
- The library of studies will include standard ProphetX studies plus those that you have created. The Most Recent will include studies that you have previously used.
- Under Add To, select the stack you want to add the study to, or select <New Stack> to create a new stack for the study. Click OK to exit.
Changing Parameters
- Do either of the following to change the parameters:
- For an existing study on a chart, right-click on the study and select Properties on the pop-up menu, and modify as necessary.
- Right-click on the study name listed in the f(x) docked pane and make the changes in the displayed dialog. Update will save the parameters permanently.
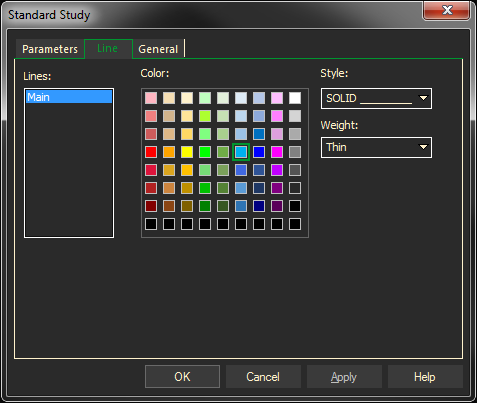
Changing Line Properties
- Right-click on the study and select Properties.
- Select the Line tab, you can set the color, style, or weight of the study line. Click on the arrows to the right of each text box, and make a selection from each list.
- Click OK to exit.
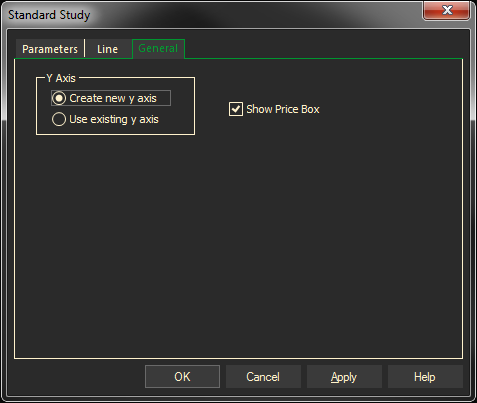
The General tab sets y-scale properties.