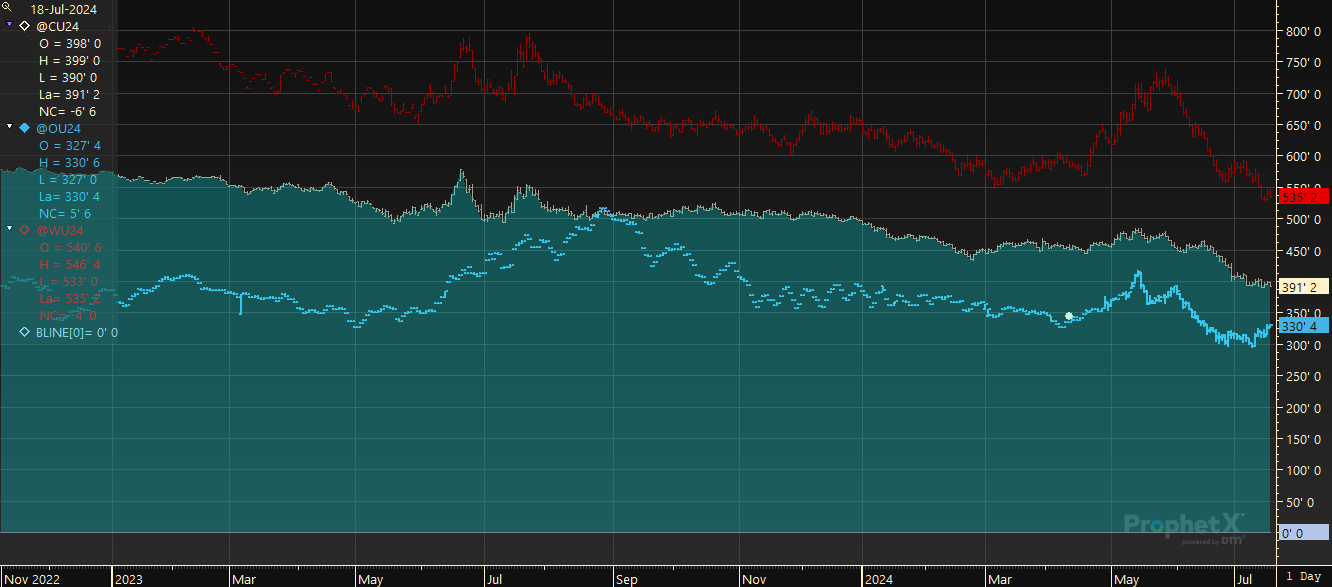
The Baseline Study plots a line at a constant value (usually 0), to shade above or below.
- Create your chart as you normally would
- Right click and select Add Study…
- Select Baseline and click OK
- In the data window, click on the diamond next to the BLINE and the symbol you want to shade between
- Right mouse click and select Shade between lines…
- Select color you want to use as shade color and click OK
Example of Chart with a Baseline Study, shading between the baseline and @OU24