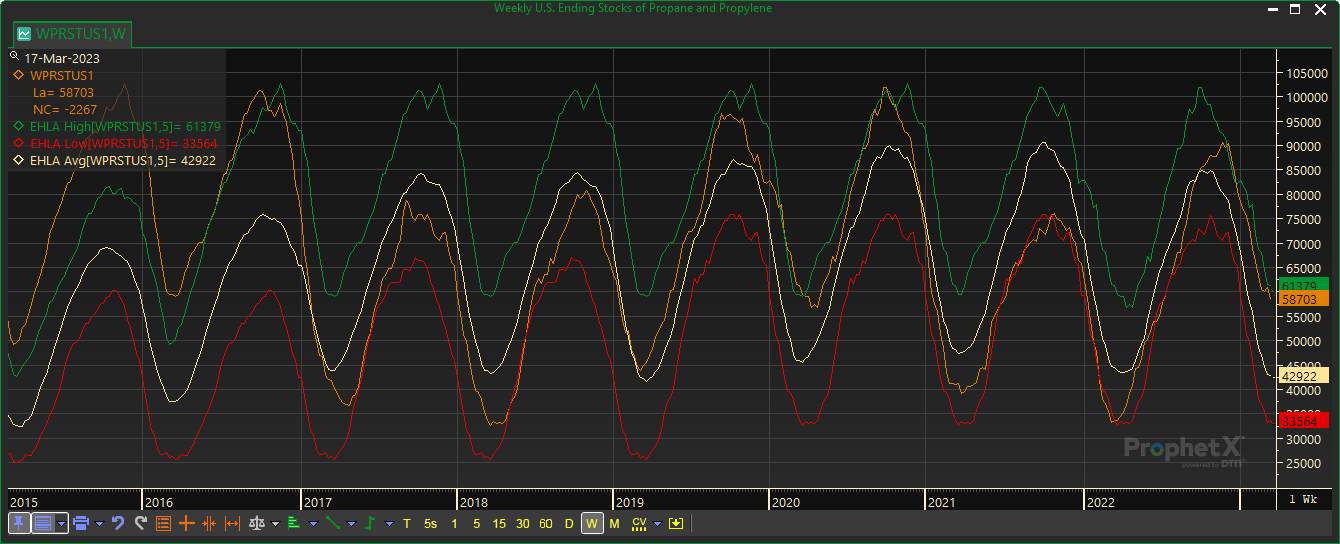
- This is a lagging year over year (5 year) study to calculate minimum, maximum and average for Weekly EIA data
- This is to be applied as a study on a standard chart, and is not intended for Seasonal Charting.
- The EIA HLA study is not applicable with X-Axis, Change Range feature

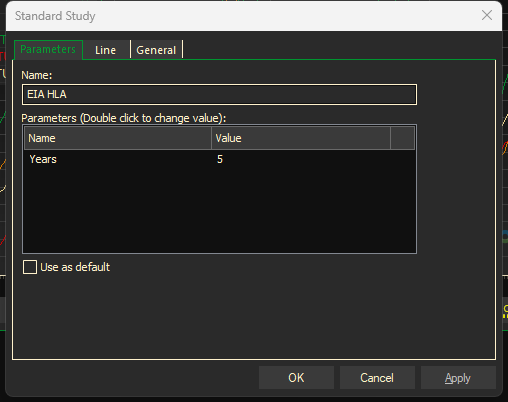
Parameters
- Right-mouse click anywhere on the chart and select Change Object Properties
- Under Charts, select EIA HLA
- Click OK
- Select Parameters, Line or General depending on what you want to modify
- Make your changes
- Click OK
