What is a Correlation Matrix and what does it do?
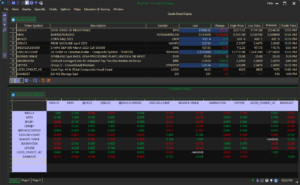
A Correlation Matrix is a table showing the statistical relationship between two or more variables. It is used to quantify the strength of the relationship between variables, and the direction of that relationship (positive or negative). Each cell in the matrix show the correlation coefficient between two variables, which is a value of -1 and 1. A correlation coefficient of 1 indicates a strong positive relationship, a coefficient of -1 indicates a strong negative relationship, and a coefficient of 0 indicates no relationship.
The Correlation Matrix is a useful tool for exploring the relationships between variables, and can provide insight into the underlying structure of the data.
How is it used in Trading?
In finance and trading, the Correlation Matrix is used to assess the relationship between various financial assets, such as stocks, bonds, commodities, currencies, etc. This information can be useful for traders and investors in several ways:
- Portfolio construction
- By understanding the relationships between assets, traders can construct portfolios that are diversified, reducing overall portfolio risk.
- Risk Management
- By identifying assets that are highly correlated, traders can better assess the risk in their portfolios and adjust accordingly.
- Trading Strategies
- Correlation information can be used to develop and back-test trading strategies that take advantage of changes in the relationships between assets.
- Market Analysis
- The Correlation Matrix can provide insight into the overall market environment and help traders understand how different sectors and assets are affected by market conditions.
Overall, the Correlation Matrix is an important tool in finance and trading, helping traders and investors to better understand and manage risk, develop profitable trading strategies, and make informed investment decisions.
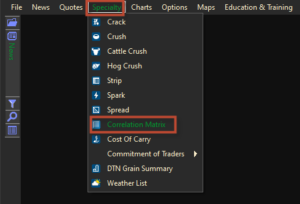
The Correlation Matrix is found under the Specialties menu
- From the Tool Bar, go to Specialty
- Click on Correlation Matrix to open display

Adding Data to the display
- Click on any of the cells in purple and type the symbol you would like to add
- By clicking on the buttons at the bottom of the display, you can change the time frame from 1 week to 5 years.
- The default is 1 year.
- Or select the Custom Period icon to add:
- Fixed start date to current day
- Fixed data range

Mirror Mode
The Mirror Mode can be turned off and on by clicking the yellow button on the Context Bar at the bottom of the display
When Mirror Mode is engaged, adding a symbol to one axis will automatically add it to the other axis as well. Mirror Mode will only function when adding symbols to the end of the axis.
When Mirror Mode is NOT engaged, adding symbols will only add to the axis you enter them on. This also allows you to insert or delete rows within the symbols already added to the Correlation Matrix.