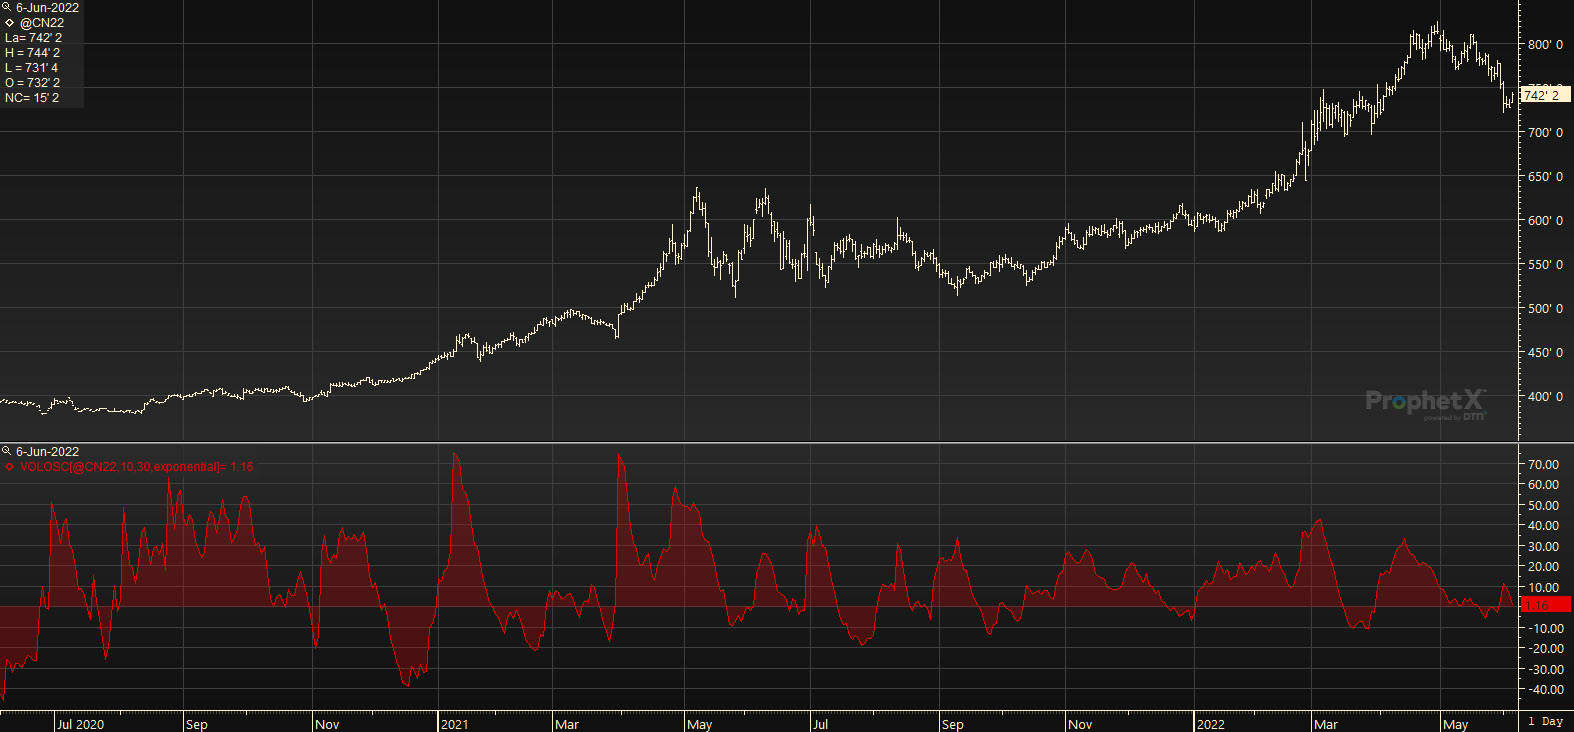
Consists of two moving averages – one fast and one slow. The fast-moving average is subtracted from the slow-moving average. The result is displayed as a percentage.
The Oscillator breaks up daily volume activity into positive and negative categories. It is positive when the current closing price is greater than the prior closing price and negative when it’s lower than the prior closing price. The resulting curve plots through relative percentage levels that yield a series of buy and sell signals.