This feature is used to create spreads and other formulas, as well as set instrument properties at the same time – such as conversion values. The Synthetic Spreads calculator also calculates the high and low results while the User Custom Studies are based solely on the close.
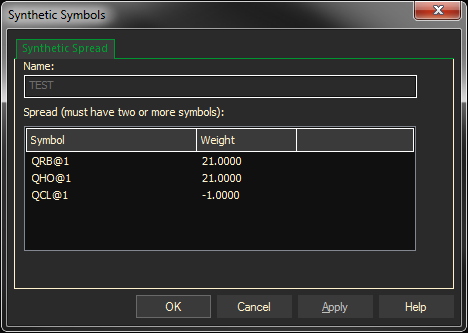
The Synthetic Spreads are a bit more complicated than basic spreads in that they can only use a + or – weighted value in the formula rather than an actual calculation, as shown below.
- Navigate to the f(x) docked pane on the left and select Synthetics.
- Right click and select New.
- The Synthetic Spread Definition dialog box will open.
- In the Symbol area, type the base symbol or formula.
- In the Weight area, type the weighted value (number to multiply by).
- Right click in the dialog and select New Entry.
- In the second line type the next base symbol or formula.
- In Weight, type + or – and the weighted value.
- Continue to add entries as necessary.
- When finished Click OK.

These Spread Definitions are also the same as typing this formula: (QRB@1+QHO@1)*21-QCL@1
However, if you enter this formula instead of the Synthetic above the high and low values will not be calculated.
*In review, use the Synthetic Spread calculator if you want a bar or candlestick chart and include the high and low calculated values. Use the individual formula or User Custom Study if you are only interested in the close and a line chart.
Here are some other examples:
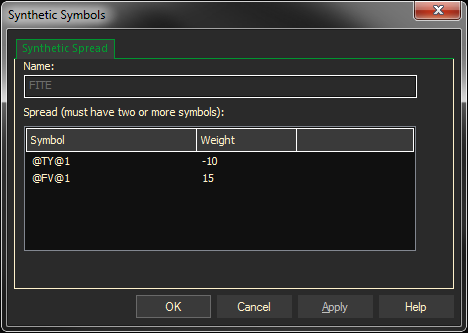
This is a spread between the five and ten year notes:

The actual formula for this is: (@FV@1*15)-(TY@1*10)
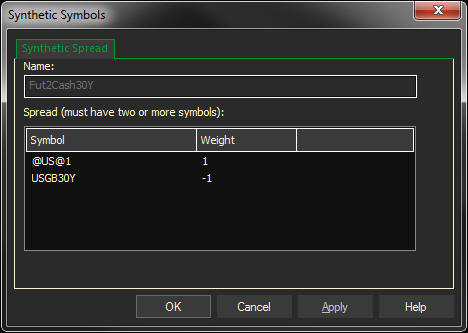
In this example we’re doing Futures to Cash spread on the US dollar vs. the 30 year

It’s the same as this formula: @US@1-USGB30Y
Because both symbols are using the same data ratio it’s not necessary to do a conversion like we did in the previous examples.
How Intraday Spread Values are Determined
Looks at high, low, open and close for all instruments and uses first open, last close, lowest low, and highest high within that time period.
How Synthetic Spreads are Calculated:
ProphetX uses a proprietary method to calculate spread values on a tick by tick basis for real time data. Minute bars are then built from the tick by tick data points.
Using the Synthetic Spread
Type a: (colon) followed by the name of the Synthetic Spread, example :BREAKEVENC
Adding a Synthetic to a Chart
A synthetic is treated like Adding a symbol to a chart. Find it in the list of synthetic symbols. Drag and hold down the CTRL key until you drop it on the chart.