The DTN ProphetX Settings have a tree-like structure for easy browsing. As shown in the sample below, it looks somewhat like an outline, with topics on the left that you can expand and collapse.
A plus sign (+) to the left of a topic folder indicates that there are sub-topics within it. Click the plus sign to expand the topic and view additional topics below. When a topic folder is expanded, a minus sign replaces the plus sign. To collapse the topic folder and hide its contents, click on the minus sign.
Click a topic heading and its settings will appear on the right side of the screen.
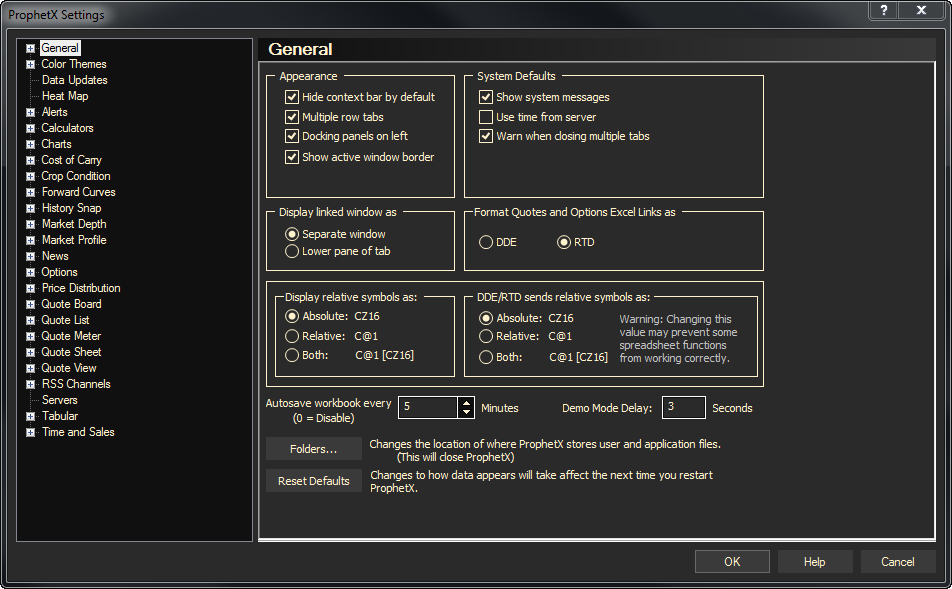
General Settings
- General Settings – General Settings provide user-defined settings for the basic, overall structure of your ProphetX displays.
- Hot Keys – Assigned/Available Hot Keys and Assignable Actions.
- Folders and Clouds – Choose where to store your ProphetX files
- ProphetX Updates – The ProphetX Updates selection under General Settings allows you to customize the DTN ProphetX Installation and Update feature.
- Context Bars – The Context Bars selection under General Settings allows you to customize each Windows Context Toolbar.
- Localization – The Localization selection under the General Settings allows you to set the currency conversion you would like to see in a quote sheet.
- Notes – The preferences for applying Notes to a chart require display configurations.
- Web Details – This preference will allow you to bring web information directly into ProphetX from a web page.
- Print – The page orientation can be set globally by selecting the Print Preference.
- Import/Export Options – The Publish/Export Options selection under General Settings allows you to auto-publish certain charts as graphic files.
Color Themes Settings
- Color Themes – The Color Themes selection allows you to customize the overall Color Theme of your DTN ProphetX.
- Customize Themes – These settings allow you to customize the individual colors for each element of a Color Theme.
- Data Updates – Data Updates will set the displays that you want to show features such as blinking, highlighting, and market conditions, as well as color preferences for each.
- Heat Map – The Heat Map Settings allow you to select the color that represents the % change up or down in an instrument. The defaults are set at green for an “up” condition and red for a “down” position. The more “up” or “down” the instruments are the more intense the colors will display.
- Alerts – Settings for Price alerts let you monitor specific changes in quote prices.
- Charts – These Settings apply to Chart and Seasonal windows.
- Cost of Carry – The Cost of Carry Setting selections provide default storage and interest rates, as well as decimal positions to be used in all of your Cost of Carry calculations.
- Crop Condition – Select the State’s you want to display. The states listed are those reporting.
- Forward Curve – The Forward Curves Settings allow you to change your default Settings.
- History Snap – History Snap Preferences let you select which fields to retrieve when you use the History Snap module.
- Market Depth – In Market Depth Settings the Active range trade count is indicated by a yellow vertical line that shows the range of values for the last “x” trades, as defined by the number entered in the Market Depth Settings dialog box.
- Market Profile – Settings for the Market Profile is a statistical display of price activity over a specified time interval.
- News – Settings for the News both Scrolling and Fixed News.
- Options – Settings for Options (ATM, Series, Strikes, Strategy, Options Calculator, and Option Publishing).
- Price Distribution – Settings for the Price Distribution chart displays the percentage of time an instrument trades at or above a range of prices using inter-day history (daily or weekly).
- Quote Board – Settings for the Quote Board is an alternate way to display quotes. Instead of columns, the quote board lists the data in rows within a cell.
- Quote / Weather List – Settings for the Quote List is another way of viewing quotes, which will ultimately be used as a dashboard display with “smart” devices.
- Quote Meter – The Quote Meter shows the current % Change as well as the high and low % Change for the day (indicated by the thin red and green lines that go with each bar.
- Quote Sheet – Settings for the the Quote Sheet windows.
- Quote View – Settings for the Quote View gives you a quick summary of any quote symbol. It shows all data that is available from the quote server for a single instrument.
- RSS Channels – Settings for RSS (Really Simple Syndication) is an easy way to get the news you want whenever it is updated. Many major news organizations publish RSS news feeds.
- Specialty – This Setting sets the default look on your calculator and specialty displays, including grid lines and headers and scroll bars.
- Tabular – Settings for tabular display provides chart data in table format.
- Time and Sales – Settings for a Time and Sales display shows all transactions that have occurred on an individual instrument during the trading day.
- US Treasury Yield – Select Treasuries to display on US Treasury Yield display
- Weekly HLA – Customize your Weekly HLA Chart