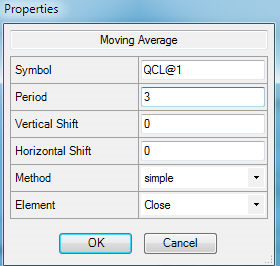
When you add a study to a history or chart display you can then highlight the study in the Symbol List and then change the study properties.
- Start by selecting History, or Charts
- Enter or look up the symbol(s) you want to display
- Click on the Action button
- Add the preferred study
- Click on the study to highlight it
- Click on the Action button again
- The properties dialog will display

- Make the changes you need and click OK
- Repeat Adding additional studies and properties as needed.
- Finally, click on OK to display the historic data and the study
