The layered weather maps display detailed weather information in a Google Map format.
This data can be added and removed randomly depending on what information you are looking for.
Once you’ve selected your preferred layers, save the settings:
- Select Favorites
- Enter a unique name in the Create New Favorites dialog box and click on Save. The next time you open a layered weather map it will open your “favorite” setting. You can save several Favorites and selected each one randomly.
Note: Some layers cannot be viewed at the same time – typically due to the amount of data that can be made visible at any given time. You can still add a layer to your selections, you just can’t view them together.
Map Layers
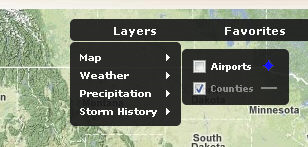
The Map Layers allow you to select airport or county locations on the map.
Weather Layers
The Weather Layers allow you to select weather related data that you would like to view on the map. Select as many as you would like. Your selections will be listed in the lower right of the map and can then be toggled on or off with the data you want to see in the map.
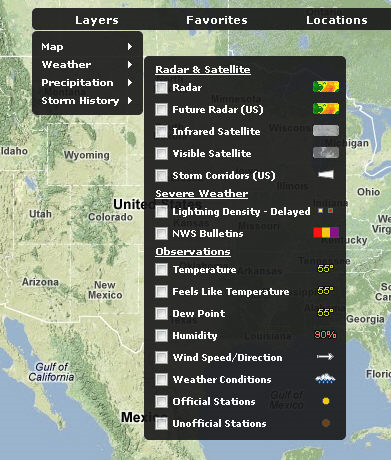

After a few seconds these settings will become transparent in the map as you view it. To display them again just hover over the area with your pointing device and it will pop up to make selections.
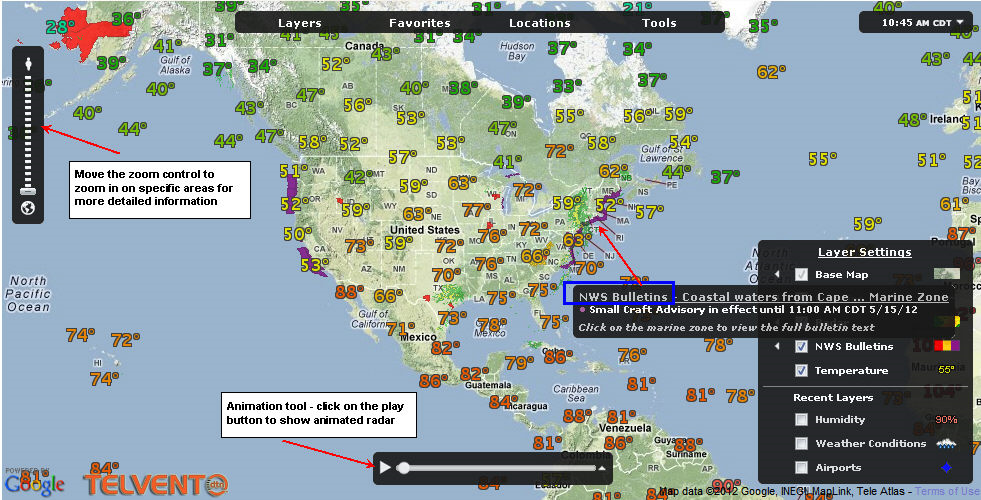
Example of a weather map with temps, radar, and National Weather Service bulletins. You can hover over any of those areas for more information.
Precipitation
As with the other layers you can view the precipitation information from the past 30 days to present time.
The “legend” to the right of the selections displays the number of inches of precipitation.
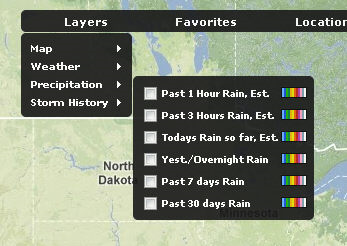

The map above shows an example of today’s estimated precipitation so far. Hover over the selection and a color legend will pop up showing precipitation amounts.

Past 1 Hour
Past 1 hour estimated rainfall (or liquid equivalent, if snow). Updated hourly.
Past 3 Hours
Past 3 hours estimated rainfall (or liquid equivalent, if snow). Updated hourly.
Today
Rainfall so far (or liquid equivalent of snow) since 7 A.M. Central Daylight Time (summer)
Rainfall so far (or liquid equivalent of snow) since 6 A.M. Central Standard Time (winter).
Updated hourly.
Yesterday-Overnight
24 hour rainfall (or liquid equivalent of snow).
Actual amount as of 7 A.M. yesterday to 7 A.M. today Central Daylight Time (summer).
Actual amount as of 6 A.M. yesterday to 6 A.M. today Central Standard Time (winter).
Updated twice daily at UTC -7 hours and UTC -11 hours.
Estimates are updated with ground observations at mid-day.
Past 7 Days
Past 7 days actual rainfall (or liquid equivalent of snow). Updated daily.
Past 30 Days
Past 30 days actual rainfall (or liquid equivalent of snow). Updated daily.
Storm History
The Storm History selection allows you to retrieve local storm reports as well as 24 hour storm information within the past 7 days.

The yellow dot and purple dots above indicate storm reports.
The storm corridors are grouped together in the lower left portion of the screen.
This example shows storm reports from South Caroline down through Florida’s east coast. Hover over the dots to get detailed information for that area.
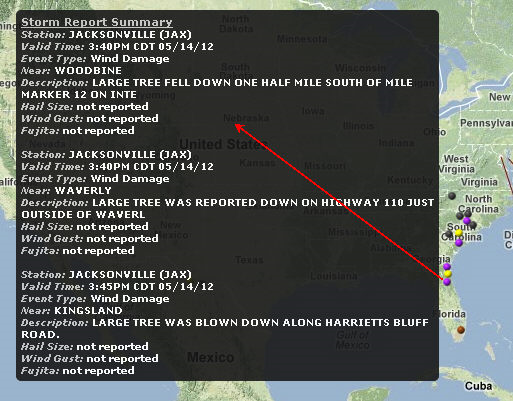
Local Storm Reports “legend”:

The Storm Corridors show the type of activity within a specific range. In order to view storm corridors you must zoom in very closely to the affected area.
The diagrams shown on the map and in the “legend” indicate the type of activity and the direction it was moving. The length of the corridor is based on where the activity will be in 30 minutes. This is calculated based on the current wind speed. Therefore some corridors are shorter than others.
The direction the activity was moving goes from the narrow to the wider end of the corridor.
The example below is the same map as above with the corridors added. When zooming down as far as we can go you can see that heavy rain and dangerous storms were moving to the west and southwest.
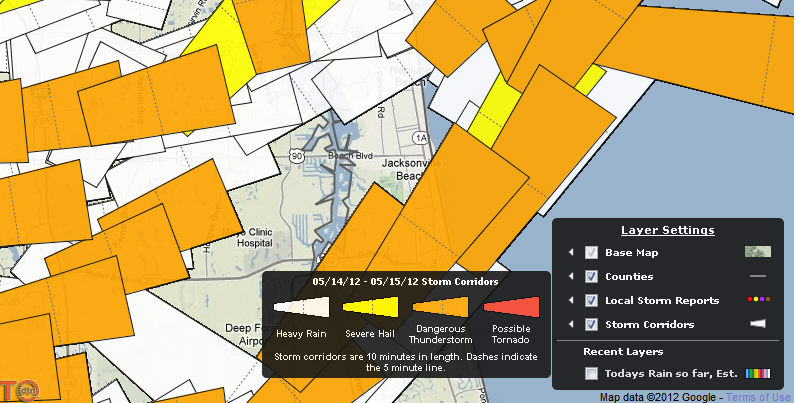
Hover over the corridors and you will get details.