The strip calculator displays averages of underlying contract prices.
To Open a Strip Display
- Select Calculator on the QUOTES menu, then NEW STRIP WINDOW.
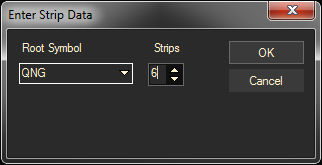
- Under Root Symbol, type the root for the symbol you want to use (e.g., QNG for electronic NYMEX Natural Gas) or click the drop-down arrow and select one from the list of those recently used.
- Under Strips, enter the number of contracts to be displayed, or click the arrow button to increase or decrease the number shown.

To Read the Strip Display
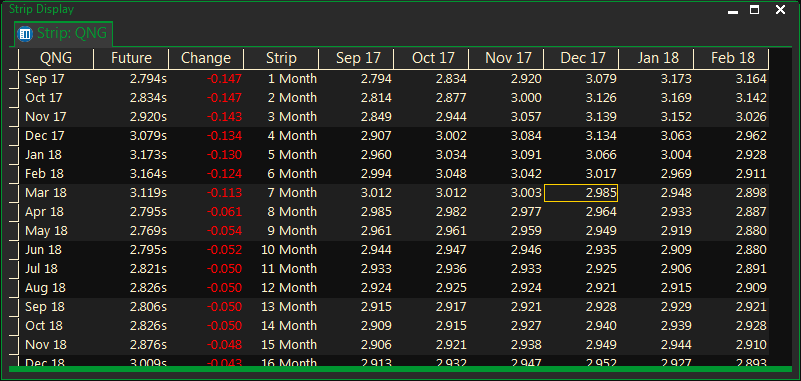
The first three columns display the current prices for each contract.
The column named “Strip” displays the number of months that are to be included in your strip calculation.

An example: If you want the price for a 6 month strip starting in the month that you want, go to that column and then down to the 6 Month row in the same column. This is your strip price.
To change Strip Window Colors
- Select the area to be changed, right-click, and select the appropriate Properties command. You can select cells, rows, columns, or the entire sheet.
- In the Properties dialog, under the Colors tab, select the element to be changed then the new color. Click Apply to view your changes while the dialog remains open.
- Repeat step 2 to make other changes, then click OK to exit.
The colors used for Update Blinks and Update Highlights can be modified in the Sheet Properties. To change other update display features, click on the Updates tab of the Strip Control Properties dialog.
To View Natural Gas Strip Averages in a Quote Sheet
Open a Quote Sheet, click on the first cell in the Ticker column, and select ADVANCE REQUEST. Make the following entries in the dialog.
Pattern: \&NG*
Exchange and Source: Any
Type: Pattern Matching
The following are Natural Gas Strip Averages.
| 3 Month Strip Average | &NG&3 |
| 6 Month Strip Average | &NG&6 |
| 9 Month Strip Average | &NG&9 |
| 12 Month Strip Average | &NG&12 |
| 18 Month Strip Average | &NG&18 |
| Summer Forward Strip Average | &NG&SUM |
| Winter Forward Strip Average | &NG&WIN |
| Summer Diminishing Strip Average | &NG&SU2 |
| Winter Diminishing Strip Average | &NG&WI2 |
For each strip, averages are included for the Open, High, Low, Last, and Change fields. For example, the 3-Month Strip Average is calculated with the near month and the next two months. If the near month is February, the 3-Month Strip Average calculation includes the months of February, March, and April (when all contracts have opened).
The Summer and Winter Strip Averages are calculated for Summer (Cooling) and Winter (Heating) seasons. The months included in the seasons are listed below.
Summer: April, May, June, July, August, September, and October
Winter: November, December, January, February, and March
Two variations of Summer and Winter strips are calculated.
- Forward strips average consecutive open months in a complete single season. When the contract for the first month of a season expires, the strip then calculates the average of consecutive months in the next complete single season.
- Diminishing strips average only the open contract months in the current season. When the contract expires for the first month of a season, only the remaining months are included in the strip calculation. For example, when the November contract expires, the strip averages December through March. When only March (one month) remains, the strip is same as the forward strip above.
OR
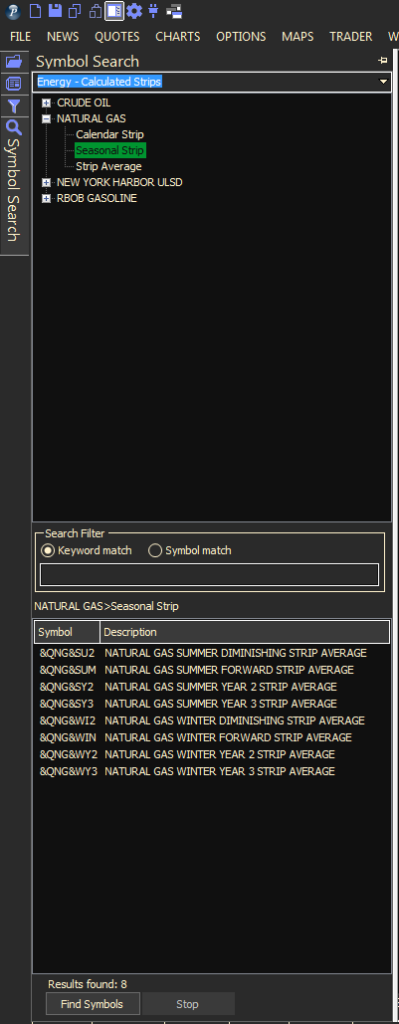
The Symbol Drilldown also contains symbols for summer and winter strips and diminishing strips,
- Hover over the flashlight icon / Symbol Search on the docked toolbar on the left and select Energy/Calculated Strips
- Select the product you want the strip symbols to display
- Highlight the symbol(s) and either right click to select New and the display you want to view, or drag and drop to an open display

For forward strips follow the instructions above and select Calendar Strip or Seasonal Strip.